RSI 추세 전략

1
Follow
1780
Followers
개요
이 전략은 상대적으로 강하고 약한 지수 ((RSI) 지표를 기반으로 RSI 지표의 값이 기본 상하 하위치를 초과했는지 판단하여 구매 및 판매 신호를 결정합니다. 이 전략은 또한 위험을 제어하기 위해 중지 및 지분 시간 제한을 설정합니다.
전략 원칙
- RSI의 값을 계산한다.
- RSI 값이 기본 구매 <unk>값보다 낮으면 구매 신호를 생성하고, RSI 값이 기본 판매 <unk>값보다 높으면 판매 신호를 생성한다.
- 구매 신호에 따라, 현재 종료 가격으로 구매 수량을 계산하고 주문 구매 <unk>.
- 만약 스톱로스 비율이 설정되어 있다면, 스톱로스 가격을 계산하고 스톱로스 주문한다.
- 판매 신호 또는 중지 조건에 따라 평점 모든 포지션을 보유하십시오.
- 최대 보유 시간 (maximum holding time) 을 설정하면, 보유 시간 (holding time) 이 최대 보유 시간 (maximum holding time) 을 초과하면, 이익과 손실에 관계없이, 모든 보유 지분을 청산한다.
전략적 이점
- RSI 지표는 널리 사용되는 기술적 분석 지표로, 시장의 과매매 및 과매매 신호를 효과적으로 포착할 수 있다.
- 이 전략은 위험을 통제하는 데 도움이 되는 스톱로스 및 포지션 보유 시간 제한을 도입했다.
- 전략의 논리는 명확하고, 이해하기 쉽고, 실행하기 쉽다.
- RSI의 변수와 마이너스를 조정하여 다양한 시장 환경에 적응할 수 있습니다.
전략적 위험
- RSI 지표는 경우에 따라 잘못된 신호를 보내서 전략에 손실을 초래할 수 있습니다.
- 이 전략은 거래 품종의 기본 요소를 고려하지 않고 기술 지표에만 의존하여 시장의 갑작스러운 위험에 직면 할 수 있습니다.
- 고정된 막부 비율은 시장의 변동성에 적응하지 못할 수 있다.
- 정책의 성능은 파라미터 설정에 의해 영향을 받을 수 있으며, 부적절한 파라미터는 정책의 성능이 좋지 않을 수 있다.
전략 최적화 방향
- 전략의 신뢰성을 높이기 위해 이동 평균과 같은 다른 기술 지표를 도입하십시오.
- 이동식 중지 또는 변동성 기반의 동적 중지와 같은 손실을 중지하는 전략을 최적화하십시오.
- 시장 상황에 따라 동적으로 조정되는 RSI의 파라미터와 <unk>값
- 전략의 위험 제어 능력을 개선하기 위해 거래 품종의 기본에 대한 분석을 결합하십시오.
- 전략에 대한 피드백과 변수 최적화를 통해 최적의 변수 조합을 찾습니다.
요약하다
이 전략은 RSI 지표를 사용하여 시장의 과매매 및 과매매 신호를 포착하고, 위험을 제어하기 위해 스톱로스 및 포지션 시간 제한을 도입합니다. 전략의 논리는 간단하고 구현 및 최적화하기가 쉽습니다. 그러나 전략의 성과는 시장의 변동과 파라미터 설정에 영향을받을 수 있으므로 전략의 안정성과 수익성을 높이기 위해 다른 분석 방법과 위험 관리 수단과 결합해야합니다.
Source
Pine
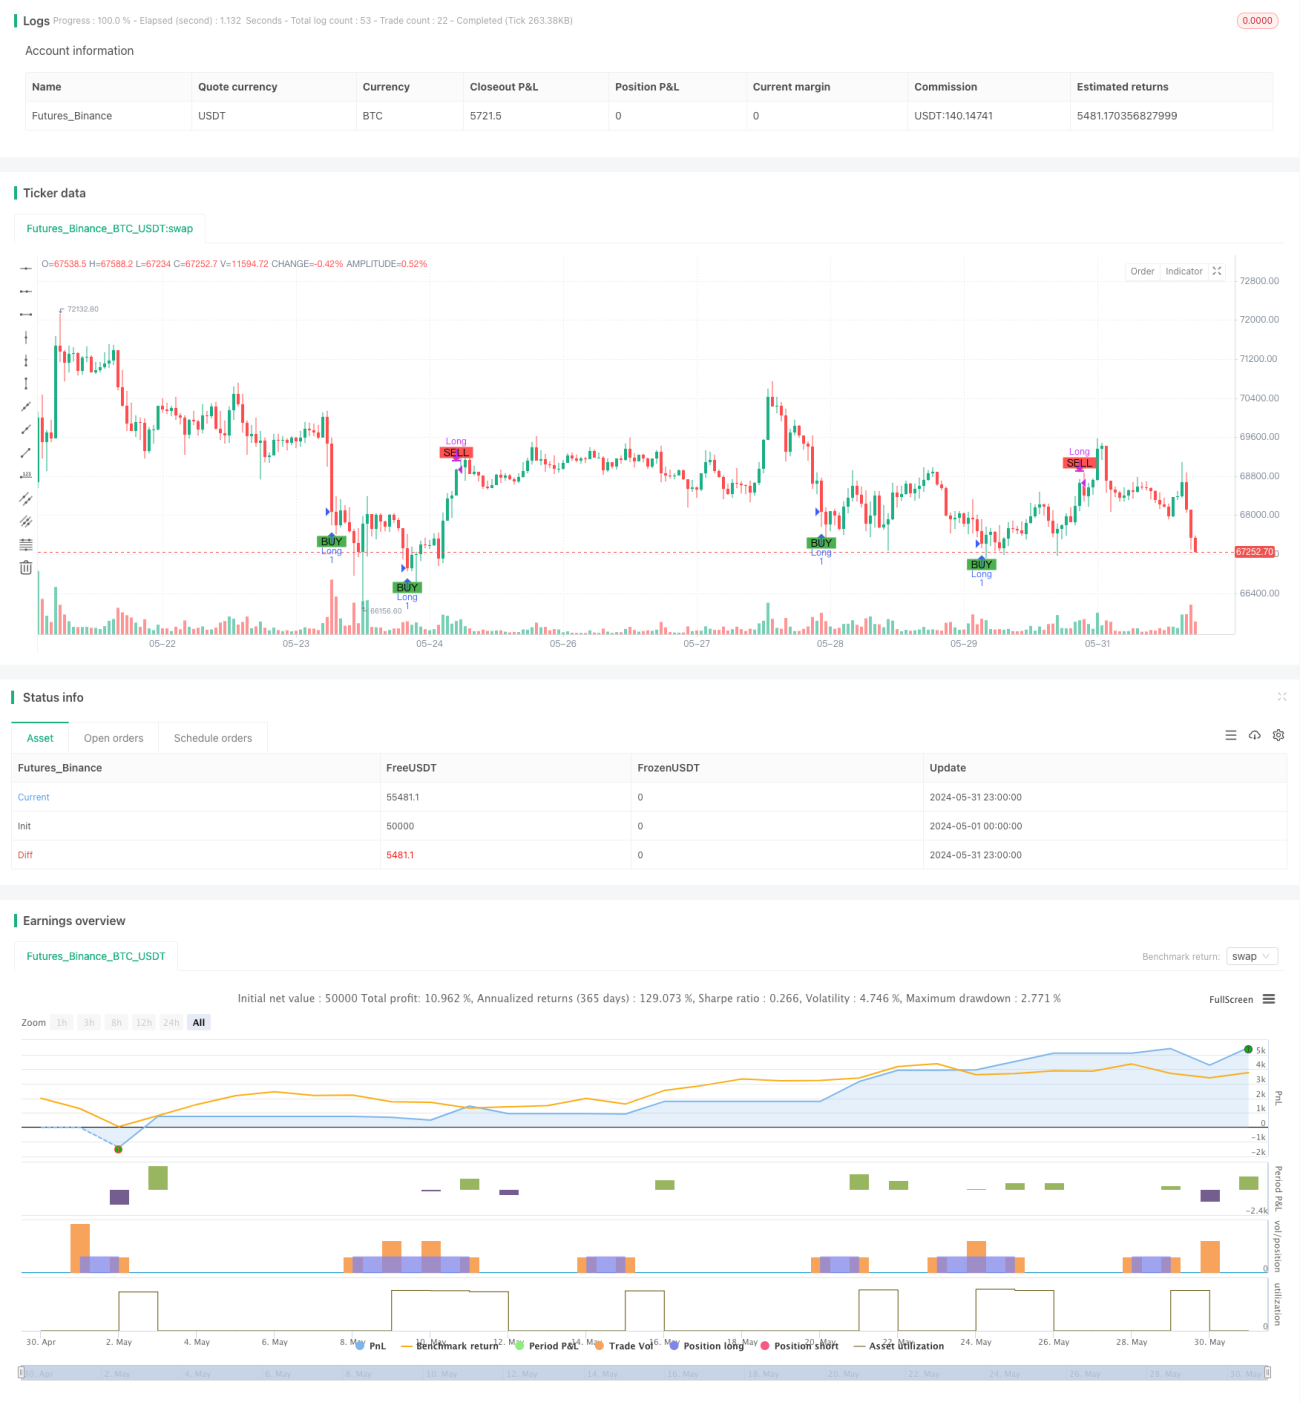
/*backtest
start: 2024-05-01 00:00:00
end: 2024-05-31 23:59:59
period: 1h
basePeriod: 15m
exchanges: [{"eid":"Futures_Binance","currency":"BTC_USDT"}]
*/

//@version=5
strategy("Simple RSI Strategy", overlay=true,  initial_capital=20, commission_value=0.1, commission_type=strategy.commission.percent)

// Define the hardcoded date (Year, Month, Day, Hour, Minute)Strategy parameters
Related strategies
Comment
All comments (0)
No data
- 1