G Trend EMA ATR 스마트 트레이딩 전략

1
Follow
1781
Followers
개요
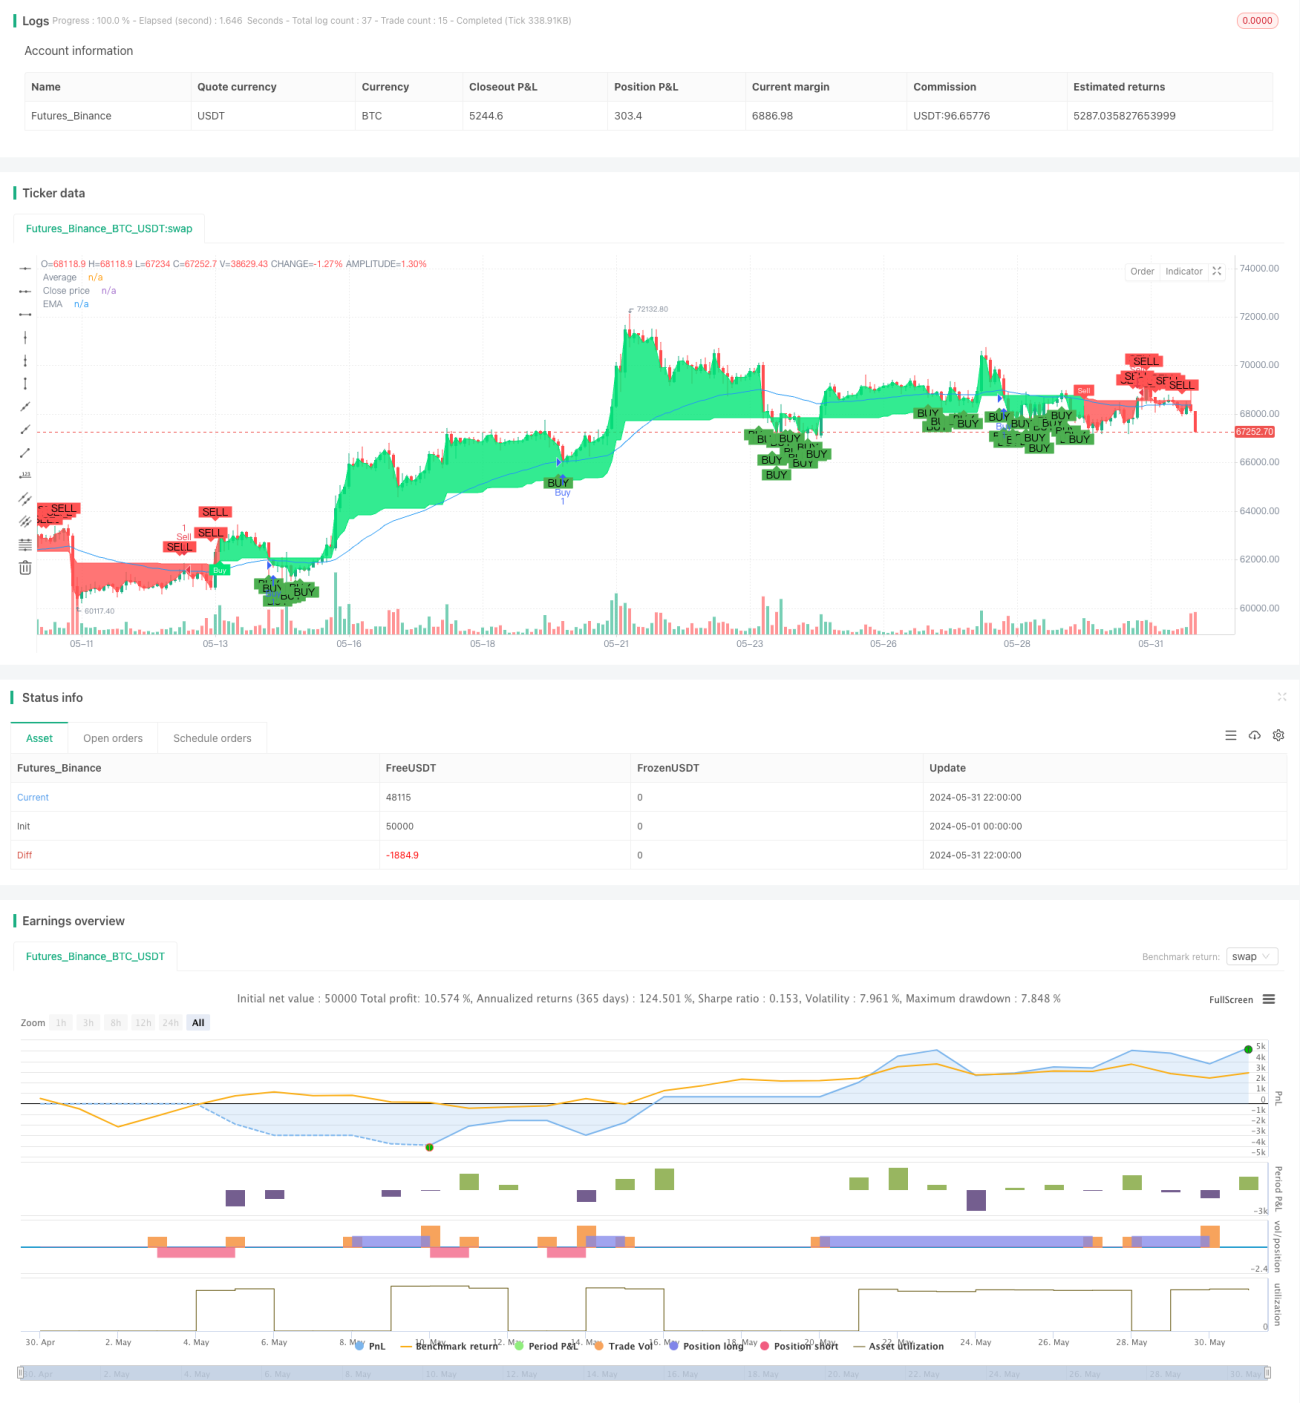
이 전략은 G 채널 지표를 사용하여 시장의 트렌드 방향을 식별하고 EMA와 ATR 지표를 결합하여 입점과 출구 지점을 최적화합니다. 전략의 주요 아이디어는: 가격이 G 채널을 돌파 할 때 G 채널의 궤도를 돌파하고 EMA의 아래쪽에 더 많이 할 때, G 채널의 궤도를 돌파하고 EMA의 위쪽에 공백을 할 때 ATR을 사용하여 동적 중지 및 중지 지점을 설정합니다.
전략 원칙
- G 채널의 상하 궤도를 계산한다: 현재 종료 가격과 이전 최고 가격의 최저 가격을 사용하여 G 채널의 상하 궤도를 계산한다.
- 트렌드 방향을 판단: 가격과 G 채널의 오르락 내리락 관계를 관찰하여 다공 트렌드를 판단한다.
- 계산 EMA: 지정된 주기의 EMA 값을 계산한다.
- ATR을 계산한다: 지정된 주기 ATR 값을 계산한다.
- 구매 조건 판단: 가격이 G 채널을 돌파하고 EMA보다 낮으면 더 많이하고, 하차를 돌파하고 EMA보다 높으면 공백을 촉발한다.
- 스톱 손실을 설정: 스톱 손실은 포지션 개시 가격-2배 ATR, 스톱 손실은 포지션 개시 가격+4배 ATR (더 많은 상점); 스톱 손실은 포지션 개시 가격+2배 ATR, 스톱 손실은 포지션 개시 가격-4배 ATR (공백 상점).
- 전략 트리거: 매매 조건이 충족될 때 상응하는 포지션 개시 동작을 실행하고, 상응하는 스톱로스를 설정한다.
전략적 이점
- 트렌드 추적: G 채널을 활용하여 시장의 트렌드를 효과적으로 포착하고, 트렌드적인 상황에 적합한 전략
- 다이내믹 스톱: ATR을 사용하여 다이내믹 스톱을 조정하여 시장의 변동에 더 잘 적응할 수 있습니다.
- 리스크 제어: 2배 ATR로 설정된 스톱로스는 거래 당 위험을 엄격히 제어한다.
- 간단하고 사용하기 쉬운: 전략의 논리는 명확하고 대부분의 투자자들이 사용할 수 있습니다.
전략적 위험
- 흔들리는 상황: 흔들리는 시장에서, 거래 신호가 자주 발생하면 손실이 증가할 수 있다.
- 매개 변수 최적화: 다른 품종과 주기에는 다른 매개 변수가 필요할 수 있으며, 맹목적으로 사용하는 것은 위험을 초래할 수 있다.
- 블랙 스완 사건: 극단적인 상황에서는 가격의 급격한 변동이 발생하여, 제약이 효과적으로 실행되지 않을 수 있습니다.
전략 최적화 방향
- 트렌드 필터링: MA 교차, DMI 등과 같은 트렌드 필터링 조건을 추가하고, 불안정한 상황에서 거래를 줄여줍니다.
- 매개 변수 최적화: 다양한 품종과 주기별로 매개 변수 최적화를 하여 최적의 매개 변수 조합을 찾는다.
- 포지션 관리: 시장의 변동성 동력에 따라 포지션을 조정하고, 자금 활용도를 높인다.
- 조합 전략: 이 전략을 다른 효과적인 전략과 결합하여 안정성을 높인다.
요약하다
이 전략은 G 채널, EMA, ATR 등의 지표를 통해 간단한 효과적인 트렌드 추적 거래 시스템을 구축한다. 트렌드 상황에서 좋은 효과를 얻을 수 있지만, 충격적인 상황에서 일반적으로 수행한다. 추세 필터, 변수 최적화, 포지션 관리, 조합 전략 등의 측면에서 전략에 대한 최적화가 가능하여 전략의 안정성과 수익성을 더욱 향상시킬 수 있다.
Source
Pine
/*backtest
start: 2024-05-01 00:00:00
end: 2024-05-31 23:59:59
period: 2h
basePeriod: 15m
exchanges: [{"eid":"Futures_Binance","currency":"BTC_USDT"}]
*/

//@version=4
// Full credit to AlexGrover: https://www.tradingview.com/script/fIvlS64B-G-Channels-Efficient-Calculation-Of-Upper-Lower-Extremities/
strategy ("G-Channel Trend Detection with EMA Strategy and ATR", shorttitle="G-Trend EMA ATR Strategy", overlay=true)
Strategy parameters
Related strategies
Comment
All comments (0)
No data
- 1