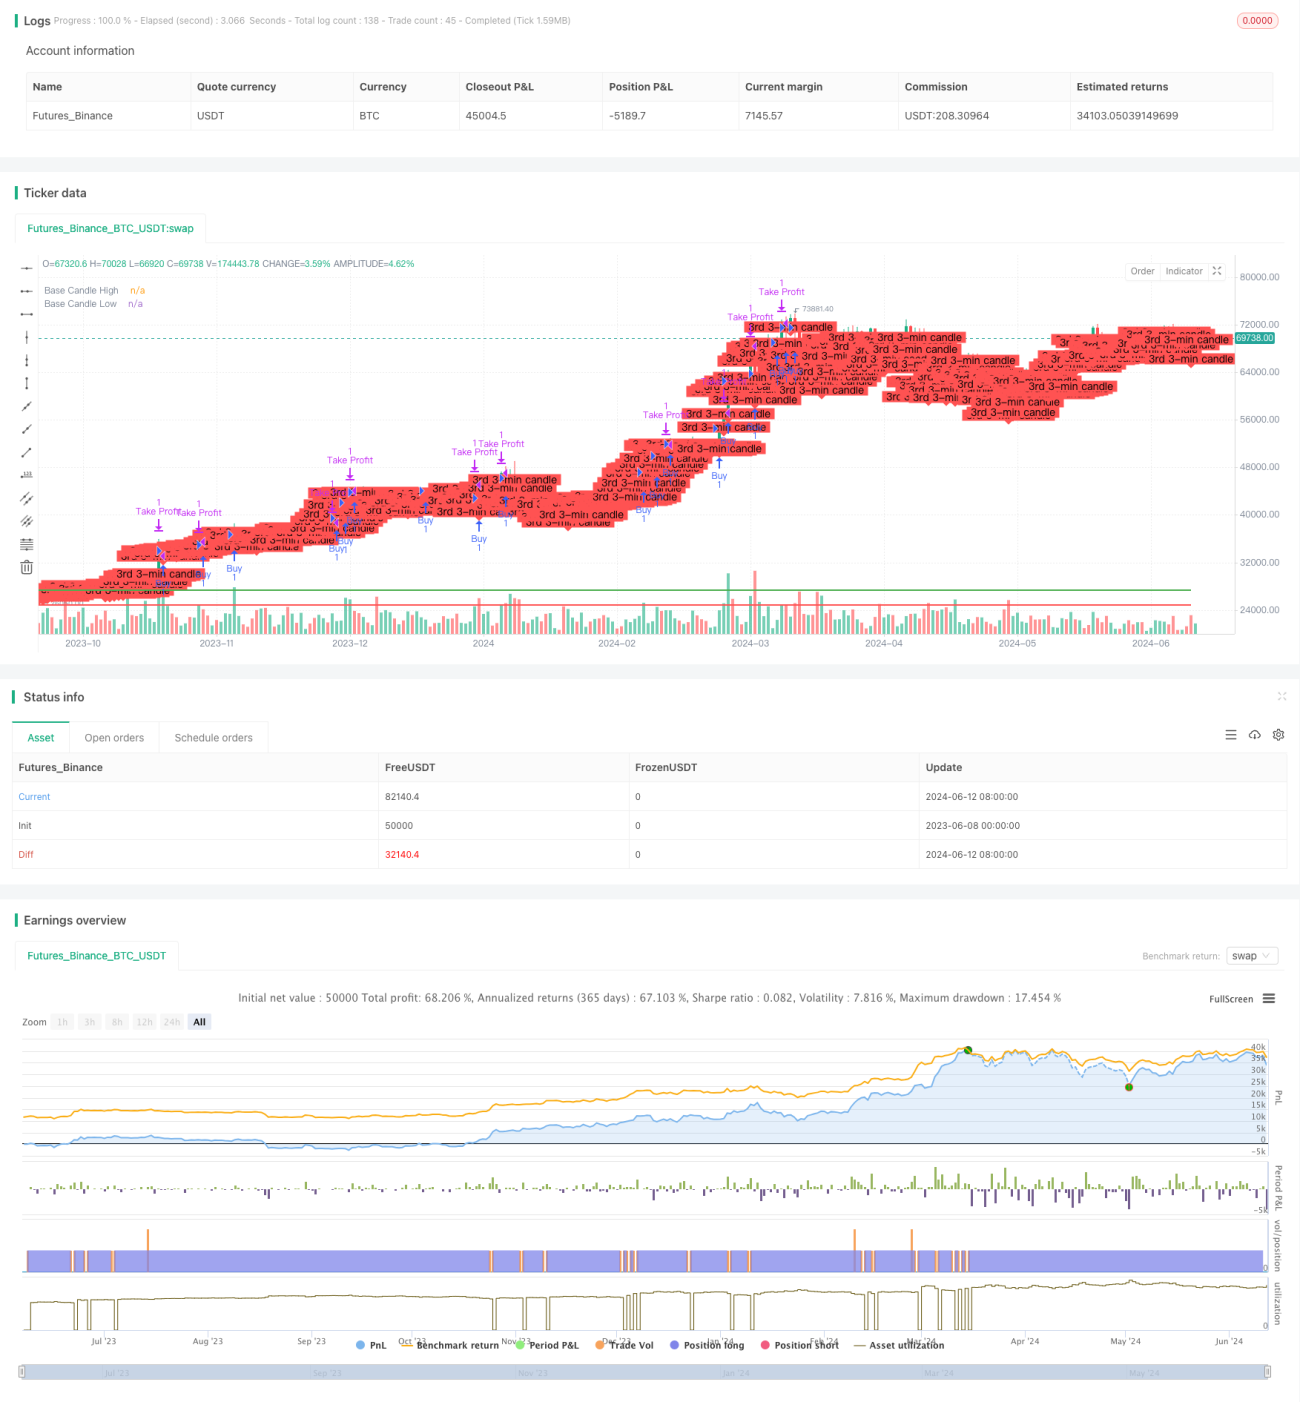
3분 K라인 고점 및 저점을 기반으로 한 일중 돌파 전략

1
Follow
1781
Followers
개요
이 전략의 주요 아이디어는 3 분 K 선의 높은 낮은 점을 뚫는 점으로 이용하는 것입니다. 가격이 3 분 K 선의 높은 점을 뚫을 때 더 많이 하고, 낮은 점을 뚫을 때 공백한다. 이 전략은 일간 거래에 적합하며, 매일 상장 시 청산하고, 다음날 계속 거래한다. 이 전략의 장점은 간단하고 이해하기 쉽고, 위험도 상대적으로 낮다는 것입니다. 그러나 이 전략에는 위험도 있습니다.
전략 원칙
- 매일 거래가 개시된 후 3분 동안의 K선 데이터를 취득하여 제3 K선 최고 가격과 최저 가격을 기록한다.
- 가격이 세 번째 K 선의 최고 가격을 돌파 할 때, 더 많은 주문을 열고, 목표 가격은 개시 가격에 100점을 더하여, 종전 또는 목표 가격 평점에 도달 할 때까지.
- 가격이 세 번째 K 선의 최저 가격을 돌파 할 때, 공명 상표를 열고, 목표 가격은 개시 가격으로 100점을 줄이고, 종전 또는 목표 가격 평준을 달성 할 때까지.
- 매일매일 거래가 끝나면 매장을 정리하고 다음 날에는 거래가 계속됩니다.
전략적 이점
- "이건 정말 간단하고, 이해하기 쉽고, 실행하기 쉽습니다".
- 일일 거래에 적합하며, 자금 활용률이 높습니다.
- 위험은 상대적으로 낮고, 막힘은 명확하다.
- 유행성이 강한 시장에 적용된다.
전략적 위험
- 시장의 변동이 큰 경우, 큰 회전이 발생할 수 있습니다.
- 오픈 시간 동안 가격 변동이 많고 위험도 높다.
- 이 사건의 배경은 알바카르타의 <unk>바카르타에 있는 <unk>바카르타의 <unk>바카르타에 있는 <unk>바카르타에 있는 <unk>바카르타입니다.
전략 최적화 방향
- 이동 평균과 같은 지표들을 추가하는 것을 고려할 수 있으며, 이는 진동시장의 노이즈 신호를 필터링할 수 있다.
- 포지션 개시 시기를 최적화하여 상장 시기를 피하는 것이 고려될 수 있다.
- 스티드포드 스톱로스 위치를 최적화하여 전략의 안정성을 높이는 것을 고려할 수 있다.
- 포지션 관리에 참여하여 철회 위험을 통제하는 것을 고려할 수 있습니다.
요약하다
이 전략은 3분 K 선의 고저점 돌파를 기반으로, 일일 거래에 적용된다. 장점은 간단하고 이해하기 쉽고, 실행하기 쉽고, 위험은 상대적으로 낮다. 그러나 시장의 변동이 큰 경우, 큰 회수가 발생할 수 있는 위험도 있다. 필터링 신호, 포지션 개시 시간을 최적화, 스톱 손실 지점을 최적화, 포지션 관리 등에 대한 이 전략에 대한 최적화를 고려하여 전략의 안정성과 수익성을 높일 수 있다.
Source
Pine
Strategy parameters
Related strategies
Comment
All comments (0)
No data
- 1