EMA 트렌드 필터 전략

1
Follow
1781
Followers
개요
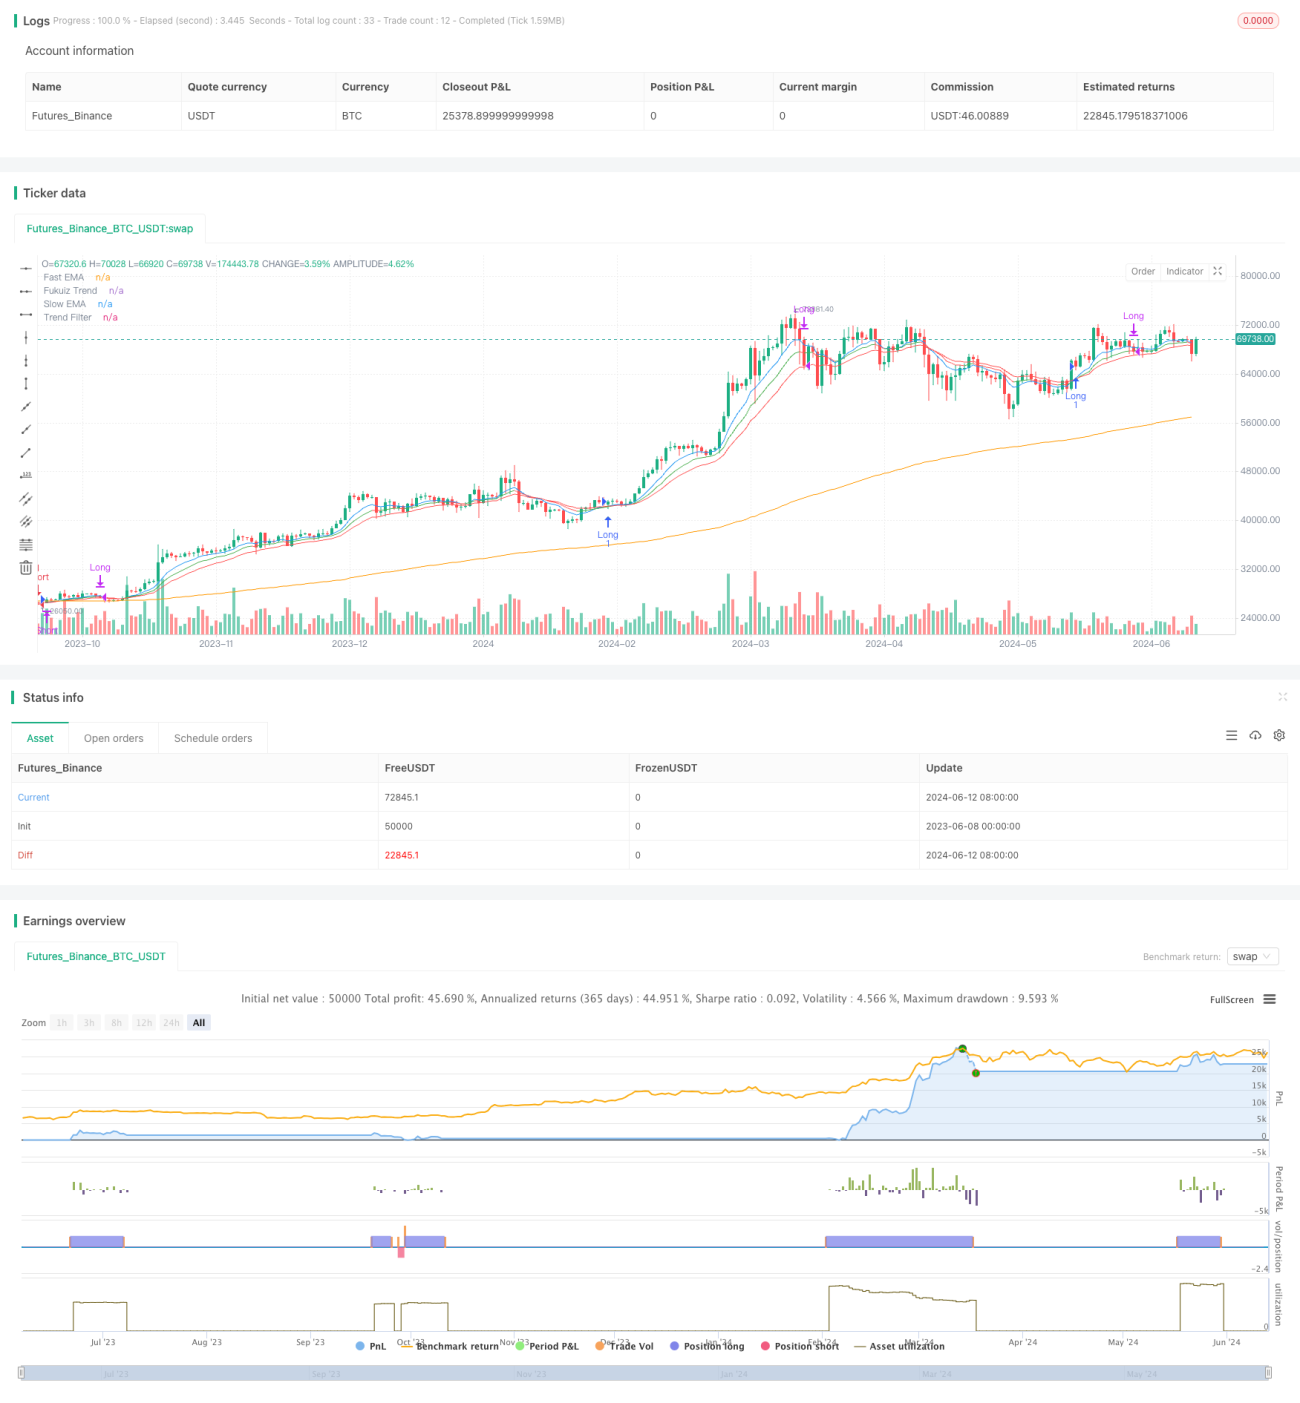
이 전략은 시장의 추세와 매매 신호를 판단하기 위해 3개의 다른 주기의 지수 이동 평균 ((EMA) 을 사용한다. 빠른 EMA, 느린 EMA 및 추세 필터 EMA의 교차, 그리고 추세 필터 EMA에 대한 가격의 위치가 전략의 핵심 논리를 구성한다. 이 전략은 또한 후쿠이즈 추세 지표를 보조 판단으로 도입하여 경우에 따라 평형 포지션을 유발한다.
전략 원칙
- 세 개의 다른 주기의 EMA를 계산합니다: 빠른 EMA ((기본 9 주기), 느린 EMA ((기본 21 주기) 및 트렌드 필터 EMA ((기본 200 주기)).
- 20주기의 가격 표준차를 계산하여 시장의 변동률을 측정한다.
- 후쿠이즈 트렌드 지표를 도입하고, 이전 주기의 크기와의 관계에 따라 색깔을 결정한다.
- 빠른 EMA가 느린 EMA를 통과하고 빠른 EMA가 느린 EMA보다 높고 가격이 트렌드 필터 EMA보다 높을 때 구매 신호가 발생한다.
- 빠른 EMA 아래에서 느린 EMA를 통과하고 빠른 EMA가 느린 EMA보다 낮고 가격이 트렌드 필터 EMA보다 낮을 때 판매 신호가 발생한다.
- 다수 상위 포지션을 보유할 때, 후쿠이즈 트렌드 지표가 빨간색으로 변하면 다수 상위 포지션을 평행한다.
- 공백상 지점을 보유할 때, 후쿠이즈 트렌드 지표가 초록색으로 변하면 공백상 지점을 청산한다.
우위 분석
- 여러 주기의 EMA를 조합하여 시장의 흐름을 더 잘 포착할 수 있다.
- 후쿠이즈 트렌드 지표의 도입은 추가적인 트렌드 판단 근거를 제공하며, 경우에 따라서는 손실을 막는 역할을 한다.
- 매개 변수는 조정 가능하며, 적응력이 강하며, 다른 시장과 주기에 따라 최적화할 수 있다.
위험 분석
- EMA는 본질적으로 지연 지표이며, 시장이 빠르게 변할 때 신호 지연이 발생할 수 있다.
- 트렌드 필터링은 EMA 주기가 길기 때문에 전략이 일부 단기 트렌드를 놓칠 수 있습니다.
- 후쿠이즈 트렌드 지표의 평소 위치 논리는 전략의 조기 중단으로 이어지는 트렌드를 놓치게 할 수 있습니다.
최적화 방향
- 각 EMA의 주기 변수를 최적화하여 현재 시장에 가장 적합한 변수 조합을 찾습니다.
- RSI, MACD 등과 같은 다른 보조 지표를 도입하여 더 많은 입출장 기반을 제공합니다.
- 후쿠이즈 트렌드 지표의 상쇄 논리를 최적화하여, 예를 들어, 조기 상쇄를 방지하기 위해 특정 보호 구역을 추가합니다.
- 포지션 관리 및 위험 제어 모듈을 추가하여 전략의 안정성과 위험 저항성을 향상시키는 것을 고려하십시오.
요약하다
이 전략은 여러 주기적 EMA의 조합과 후쿠이즈 트렌드 지표의 보조를 통해 비교적 완전한 트렌드 판단과 거래 프레임워크를 구축한다. 전략 논리는 명확하고, 매개 변수는 조정 가능하며, 적응력이 강하다. 그러나 동시에 신호 지연, 트렌드 판단 편차 등과 같은 몇 가지 잠재적인 위험도 존재한다.
Source
Pine
Strategy parameters
Related strategies
Comment
All comments (0)
No data
- 1