간단한 조합 전략: 피벗 포인트 슈퍼트렌드와 더블 지수 이동 평균

1
Follow
1780
Followers
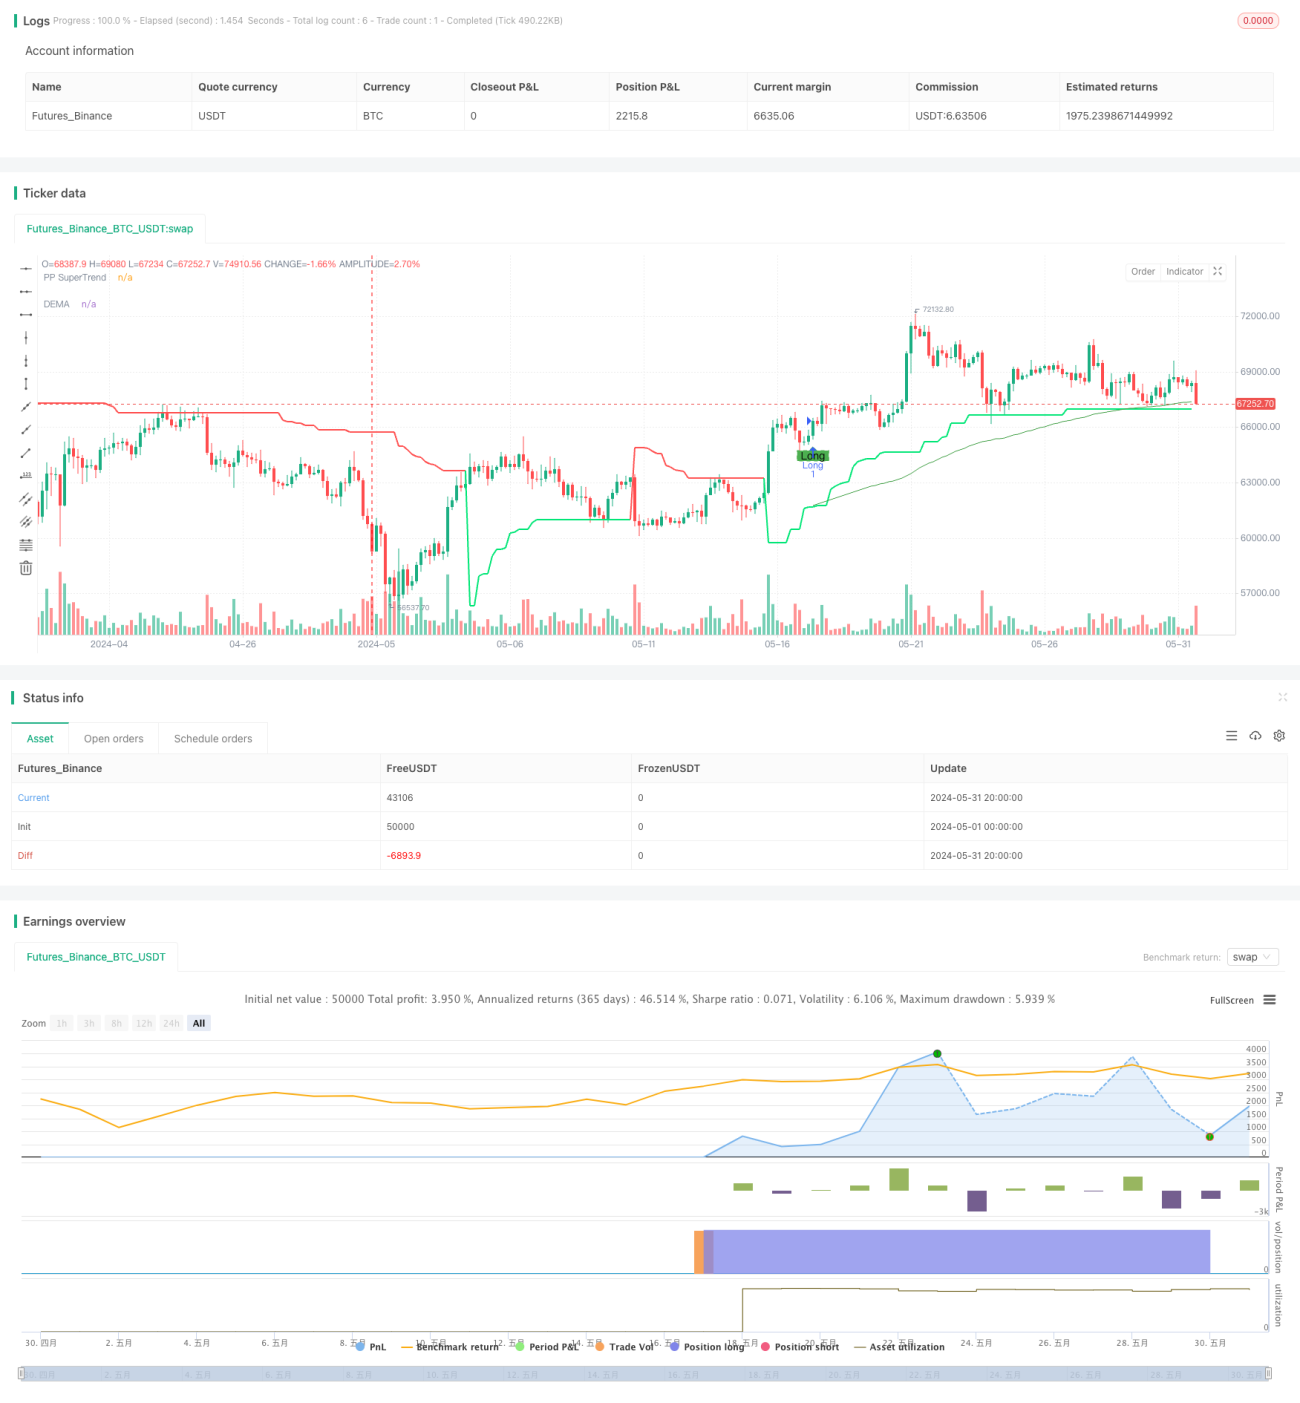
개요
이 전략은 중심축 슈퍼 트렌드 지표와 이중 지수 이동 평균 ((DEMA) 지표를 결합하여 가격의 두 지표 사이의 위치 관계를 분석하여 거래 신호를 판단한다. 가격이 중심축 슈퍼 트렌드 지표를 뚫고 DEMA 지표보다 높을 때, 다중 신호를 생성하고, 가격이 중심축 슈퍼 트렌드 지표를 넘어 DEMA 지표보다 낮을 때, 공백 신호를 생성한다. 이 전략은 시장의 중장기 추세를 포착할 수 있으며, 또한 단기간에 가격 변동에 대응할 수 있다.
전략 원칙
- 축점 슈퍼 트렌드 지표를 계산: 일정 주기 동안의 최고 가격과 최저 가격의 평균값을 중심점으로 계산한 다음 평균 실제 파장 ((ATR) 에 따라 궤도 상하를 계산하여 역동적인 지지점과 저항점을 형성한다.
- DEMA 지수를 계산한다: 먼저 종식 가격의 지수 이동 평균을 계산한다. 그리고 EMA에 대한 지수 이동 평균을 한 번 더 하고, 마지막으로 두 배의 EMA에서 DEMA를 빼서 최종 DEMA 지수를 얻는다.
- 거래 신호를 생성한다: 종결 가격이 중심축 지점 슈퍼 트렌드 궤도를 깨고 DEMA 지표보다 높을 때, 다중 신호를 생성한다; 종결 가격이 중심축 지점 슈퍼 트렌드 궤도를 깨고 DEMA 지표보다 낮을 때, 공백 신호를 생성한다.
- 스톱로스 및 스톱<unk>을 설정: 포인트 값 ((Pip Value) 과 기본 설정된 스톱로스 포인트 수 ((Stop Loss Pips) 과 스톱로스 포인트 수 ((Take Profit Pips) 에 따라 구체적인 스톱로스 가격과 스톱<unk> 가격을 계산한다.
전략적 이점
- 트렌드 추적 능력이 강합니다. 초고속 트렌드 지표는 시장의 추세를 효과적으로 포착 할 수 있으며, DEMA 지표는 가격 소음을 제거하여 더 부드러운 추세 판단 기반을 제공하며, 두 가지 조합은 시장의 주요 추세를 정확하게 파악 할 수 있습니다.
- 적응력: 중심점 슈퍼 트렌드 지표의 상승과 하락을 동적으로 조정하여 다양한 시장 변동 상황에 적응하여 전략의 적응력을 향상시킬 수 있습니다.
- 위험 제어 능력: 명확한 중지 손실 및 중지 위치를 설정하여 단일 거래의 위험 경계를 효과적으로 제어 할 수 있으며, 또한 이미 수익을 적시에 잠금 할 수 있습니다.
전략적 위험
- 매개 변수 설정 위험: 전략의 성능은 축점 주기, ATR 인자, DEMA 길이는 등과 같은 여러 매개 변수의 설정에 의존합니다. 다른 매개 변수 조합은 전략 성능에 큰 차이를 초래할 수 있으며 신중한 선택과 최적화가 필요합니다.
- 흔들리는 시장 위험: 흔들리는 시장 환경에서, 거래 신호의 빈도는 과도한 거래로 이어질 수 있으며, 이로 인해 거래 비용과 슬라이드 포인트 위험이 증가한다.
- 추세 전환 위험: 시장 추세 전환이 발생하면 전략이 연속적인 손실을 초래할 수 있으며, 다른 분석 수단과 결합하여 전략이 제때 조정되어야 합니다.
전략 최적화 방향
- 변수 최적화: 다양한 시간 주기 및 거래 품종에 대한 변수 최적화 테스트를 통해 최적의 변수 조합을 찾아 전략의 안정성과 수익성을 높인다.
- 신호 필터링: 거래 신호가 발생했을 때, 다른 기술 지표 또는 가격 행동 특성과 결합하여 신호의 신뢰성을 높이고, 가짜 신호로 인한 손실을 줄일 수 있습니다.
- 포지션 관리: 시장의 변동성과 계좌의 위험 감수성에 따라 각 거래의 포지션 크기를 동적으로 조정하여 전체 위험 경로를 제어하십시오.
- 포트폴리오 최적화: 이 전략을 다른 전략이나 거래 시스템과 결합하여 위험을 분산하고 안정성을 강화하여 전략의 장기적 성능을 향상시킵니다.
요약하다
이 전략은 중심점 슈퍼 트렌드 지표와 DEMA 지표의 결합을 통해 시장 트렌드를 더 잘 포착 할 수 있으며, 단기 변동에도 대응 할 수 있습니다. 전략은 트렌드 추적 능력, 적응력, 위험 제어 능력 등의 장점을 가지고 있지만, 동시에 변수 설정, 시장의 흔들림 및 트렌드 전환과 같은 위험에 직면합니다. 변수 최적화, 신호 필터링, 포지션 관리 및 포트폴리오 최적화 등의 수단을 통해 전략의 안정성과 수익성을 더욱 향상시킬 수 있으며, 다양한 시장 환경에 더 잘 적응 할 수 있습니다.
Source
Pine
Strategy parameters
Related strategies
Comment
All comments (0)
No data
- 1