Fisher Transform 동적 임계값 추세 추적 전략

1
Follow
1781
Followers
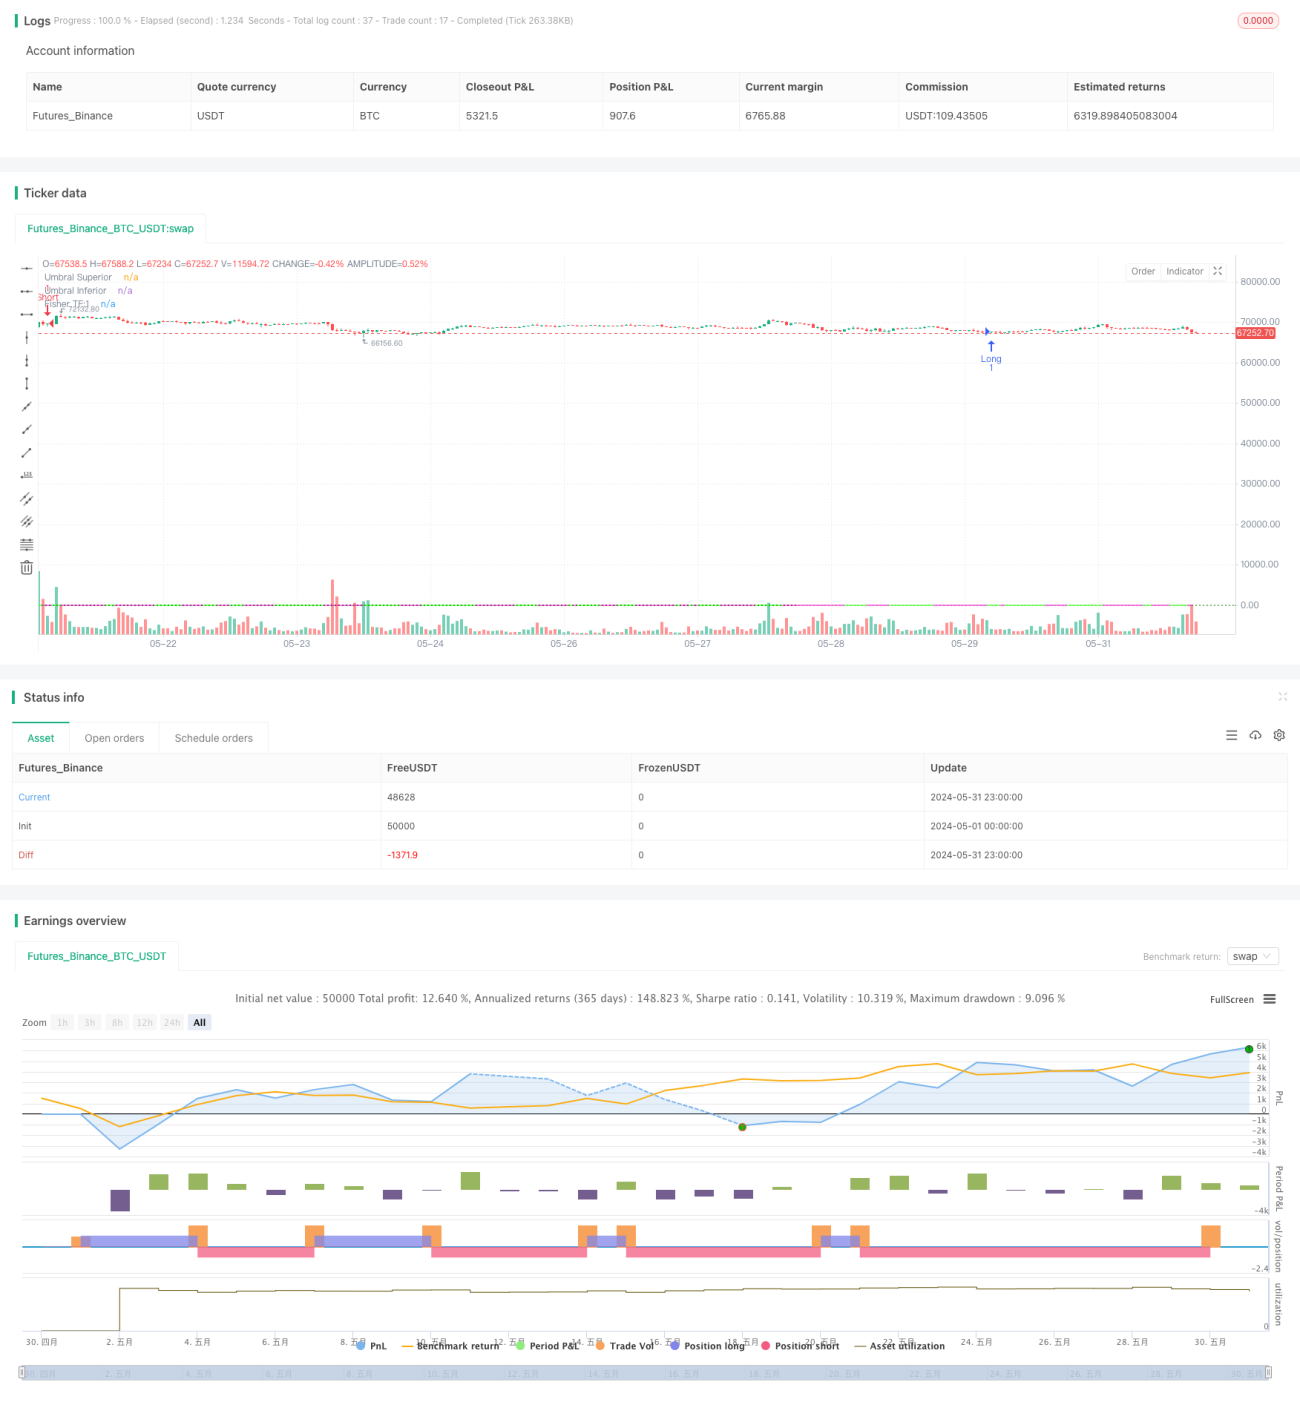
개요
피셔 변동 동적 하락 트렌드 추적 전략은 피셔 변동 지표에 기반하여 가격 트렌드의 변화를 식별한다. 이 전략은 피셔 변동을 사용하여 가격을 표준 스케일로 정형화하여 잠재적인 트렌드 역점을 더 쉽게 감지한다.
전략 원칙
- 피셔 변수 값을 계산한다: 역사적 최고 가격과 최저 가격에 따라 현재 가격을 통일 처리하여 -0.999에서 0.999 사이의 피셔 변수 값을 얻는다.
- 동적 하락: 피셔 변동 값의 역사적인 변동에 따라 시장의 다른 상태에 적응하기 위해 구매 신호의 하락을 동적으로 조정합니다.
- 추세 판단: 현재 피셔 변수 값과 이전 두 번의 값을 비교하여 가격 추세의 변화를 판단한다.
- 매수 신호: 피셔 변수가 아래로 올라가는 동안 마이너스 마이너스를 통과하면 매수 신호가 발생한다. 피셔 변수가 위로 내려가는 동안 마이너스 마이너스를 통과하면 매수 신호가 발생한다.
우위 분석
- 동적 하락 조정: 시장의 변동에 따라 구매 및 판매 하락을 조정하여 트렌드 판단의 정확성을 향상시킵니다.
- 트렌드 추적: 피셔 변환 지표의 트렌드 판단을 통해 시장 트렌드를 더 잘 포착하고 트렌드 추적 거래를 구현할 수 있다.
- 가격 잡음을 줄여: 피셔 변환은 가격을 일원화하여 가격 잡음이 트렌드 판단에 미치는 영향을 줄이는 데 도움이됩니다.
- 직관적인 차트 표시: 전략은 피셔 변동 곡선과 하락선을 차트에 그리며, 거래자가 시장의 추세와 매매 신호를 직관적으로 관찰할 수 있도록 한다.
위험 분석
- 변수 최적화 위험: 전략의 성능은 피셔 변동주기, 동적 하락값 계산 방법 등의 변수 선택에 의존하며, 다른 변수는 다른 거래 결과를 초래할 수 있다.
- 트렌드 인식 지연: 피셔 변동 지표의 가격 트렌드 판단에는 약간의 지연성이 있으며, 일부 트렌드 상황을 놓칠 수 있다.
- 흔들리는 시장에서 부실한 성과: 흔들리는 시장 환경에서, 빈번한 추세 변화가 이 전략이 더 많은 가짜 신호를 생성하도록 만들 수 있으며, 거래가 부실하게 수행될 수 있다.
- 극한 상황 위험: 극한 상황 (즉, 급격한 변화) 에서, 피셔 변동 지표가 실패하여 전략이 잘못된 거래 결정을 내릴 수 있습니다.
최적화 방향
- 파라미터 최적화: 피셔 변동주기, 동적 하락값 계산 방법과 같은 핵심 파라미터를 최적화하여 다양한 시장 상태에서 전략의 적응성을 향상시킵니다.
- 신호 필터링: 트렌드 식별에 기초하여 다른 기술 지표 또는 시장 감정 지표를 도입하여 거래 신호를 2차 확인하여 신호 신뢰성을 향상시킵니다.
- 손해 막기: 합리적인 손해 막기 규칙을 설정하고, 단일 거래의 위험을 제어하고, 전략의 위험-수익 비율을 향상시킵니다.
- 포지션 관리: 시장 추세 강도, 가격 변동률 등의 요인에 따라 포지션 크기를 동적으로 조정하여 포지션 위험을 줄인다.
요약하다
피셔 변동 동적 하락 트렌드 추적 전략은 피셔 변동 지표와 동적 하락을 통해 가격 트렌드의 변화를 식별하고 다양한 시장 상태에 적응한다. 이 전략은 시장 트렌드를 더 잘 포착하고 트렌드 추적 거래를 구현한다. 전략의 장점은 동적 하락을 조정하고 가격 잡음 방해를 줄이고 직관적인 차트를 보여주는 데 있다. 그러나 동시에 변수 최적화 위험, 추세 정체, 흔들림 시장의 부실성, 극단적 행동 위험 등의 문제가 있습니다. 변수 최적화, 신호 넘어서기, 스톱포드, 포지션 관리 등의 조치를 통해 전략의 안정성과 수익성을 더욱 향상시킬 수 있습니다.
Source
Pine
Strategy parameters
Related strategies
Comment
All comments (0)
No data
- 1