EMA와 슈퍼트렌드를 결합한 양적 트레이딩 전략

1
Follow
1781
Followers
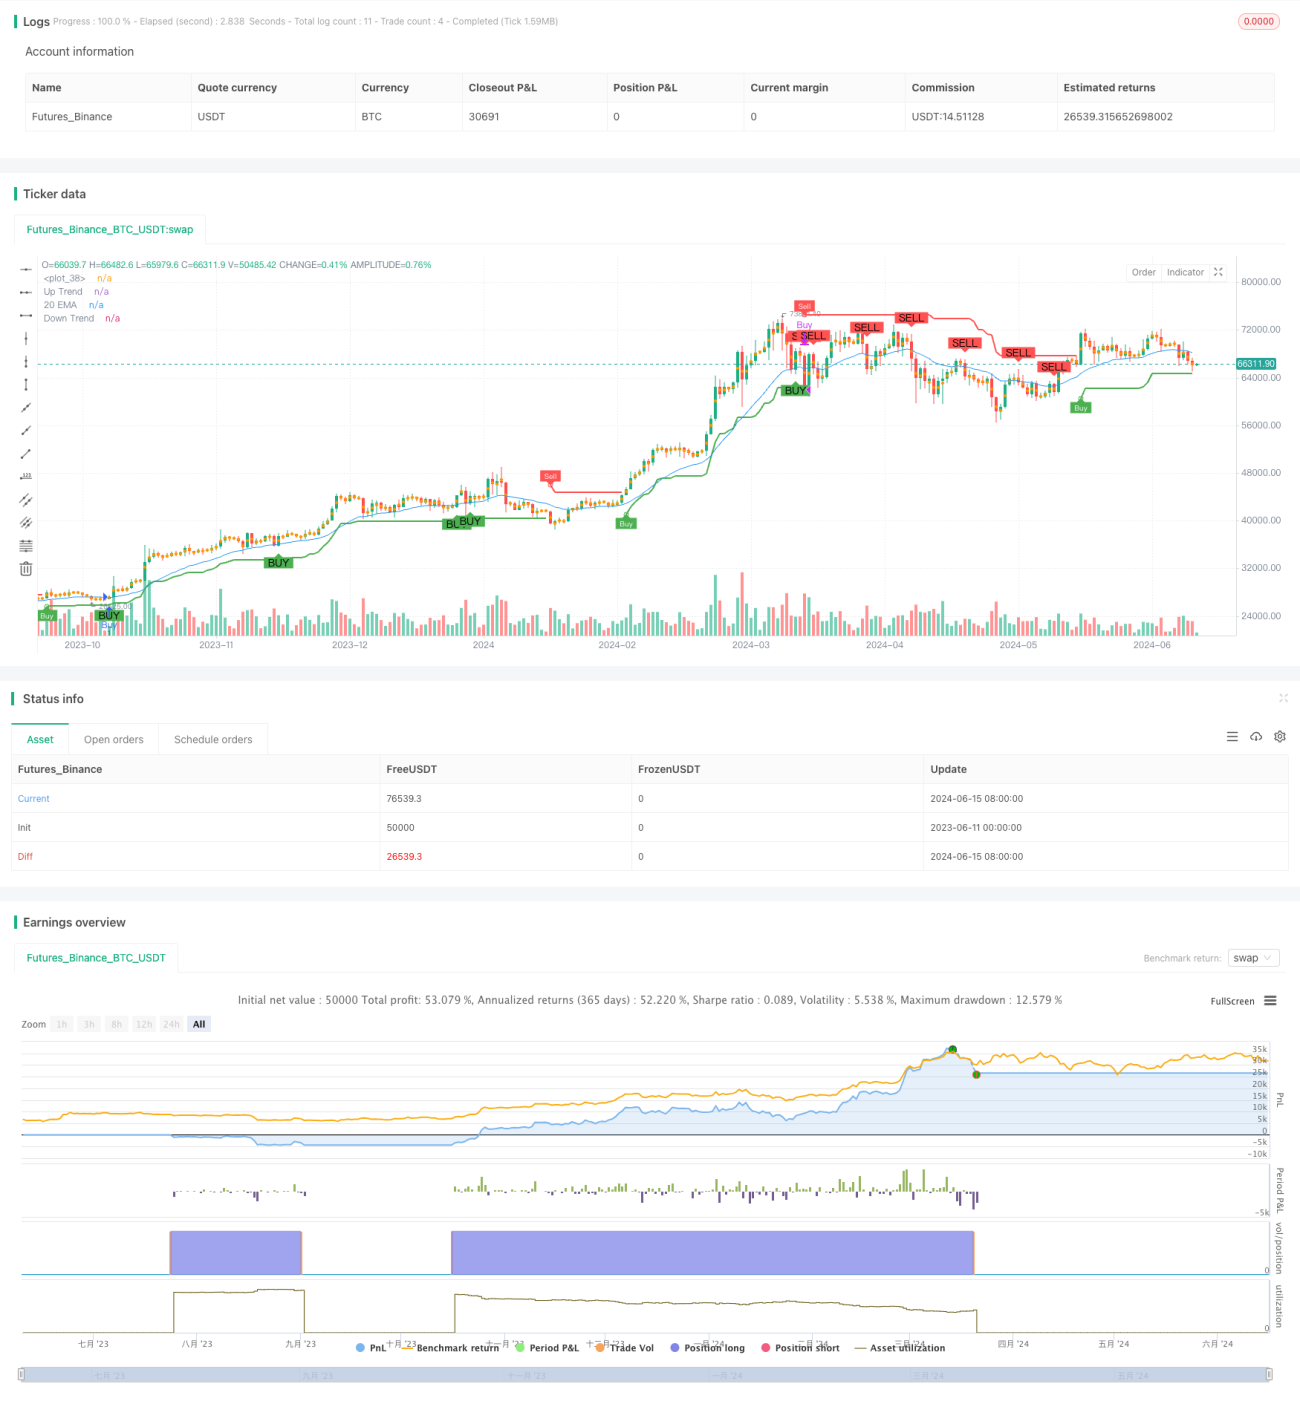
개요
이 전략은 지수 이동 평균 ((EMA) 와 슈퍼 트렌드 지표 ((Supertrend) 를 결합하여 매매 신호를 생성한다. 가격이 20 일간 EMA를 상단에서 돌파하고 슈퍼 트렌드 지표가 부진적 경향에 있을 때 매매 신호를 생성한다. 가격이 20 일간 EMA를 하단에서 돌파하고 슈퍼 트렌드 지표가 하향적 경향에 있을 때 매매 신호를 생성한다. 이 전략은 트렌드적 행동을 포착하는 동시에 가짜 신호를 줄이기 위해 EMA를 필터링 조건으로 사용한다.
전략 원칙
- 20일 EMA를 추세 판단의 필터 조건으로 계산한다.
- 슈퍼 트렌드 지표를 계산하여 평균 실제 범위 ((ATR) 와 다공계 트렌드를 기반으로 궤도를 그리는 것을 말한다.
- 슈퍼 트렌드 지표의 트렌드 방향과 가격이 20일 EMA와 비교되는 위치에 따라 매매 신호를 생성합니다:
- 가격이 20일 EMA를 상단에서 돌파하고 슈퍼 트렌드 지표가 부수적인 경향에 있을 때 구매 신호가 발생한다.
- 20일 EMA 아래에서 가격이 하락하고 슈퍼 트렌드 지표가 하향 추세에 있을 때 판매 신호가 발생한다.
- 전략은 구매 신호에 따라 상장하고, 판매 신호에 따라 평지한다.
전략적 이점
- EMA와 슈퍼 트렌드 지표가 결합되면, 트렌디스틱한 행동을 효과적으로 포착하여 가짜 신호를 줄일 수 있다.
- 슈퍼 트렌드 지표는 ATR을 기반으로 하며, 시장의 다양한 변동에 적응하기 위해 동적으로 오르락 내리락의 거리를 조정할 수 있다.
- EMA는 트렌드 판단의 필터 조건으로, 트렌드 방향에서 포지션을 개설하여 전략의 승률을 높일 수 있습니다.
- 전략의 논리는 간단하고 명확하며, 이해하기 쉽고, 실행하기 쉽습니다.
전략적 위험
- 불안정한 시장에서 이 전략은 자주 구매 신호를 발생시킬 수 있으며, 이는 과도한 거래 수와 수수료 손실을 초래할 수 있다.
- 전략은 EMA와 슈퍼 트렌드 지표에 의존하며, 특정 시장 조건에서 지표가 실패하거나 지연 될 수 있습니다.
- 전략은 위험 관리, 예를 들어 정지 및 포지션 관리를 고려하지 않습니다. 이는 시장의 급격한 변동이 있을 때 큰 회수로 이어질 수 있습니다.
전략 최적화 방향
- 단편 거래의 최대 손실을 제어하기 위해 ATR에 따라 동적 스톱을 설정하는 것과 같은 스톱 메커니즘에 가입하십시오.
- EMA와 슈퍼 트렌드 지표의 파라미터를 최적화합니다. 예를 들어, 파라미터 최적화 방법을 사용하여 최적의 파라미터 조합을 찾고, 전략의 적응성과 안정성을 향상시킵니다.
- 포지션 관리를 도입하고, 시장의 변동률이나 계좌의 손실 상황에 따라 포지션 크기를 동적으로 조정하여 전반적인 위험을 제어한다.
- 거래량, 변동성 등과 같은 다른 필터링 조건을 추가하는 것을 고려하여 가짜 신호를 더 줄일 수 있습니다.
요약하다
이 전략은 20일 EMA와 슈퍼 트렌드 지표를 결합하여 매매 신호를 생성하여 트렌드적 행동을 포착하는 것을 목적으로 한다. 전략의 장점은 논리적으로 간단하며, EMA와 슈퍼 트렌드 지표를 결합하면 가짜 신호를 효과적으로 줄일 수 있다. 그러나 불안한 시장에서 전략은 자주 거래되고 위험 관리 조치가 부족하다.
Source
Pine
Strategy parameters
Related strategies
Comment
All comments (0)
No data
- 1