
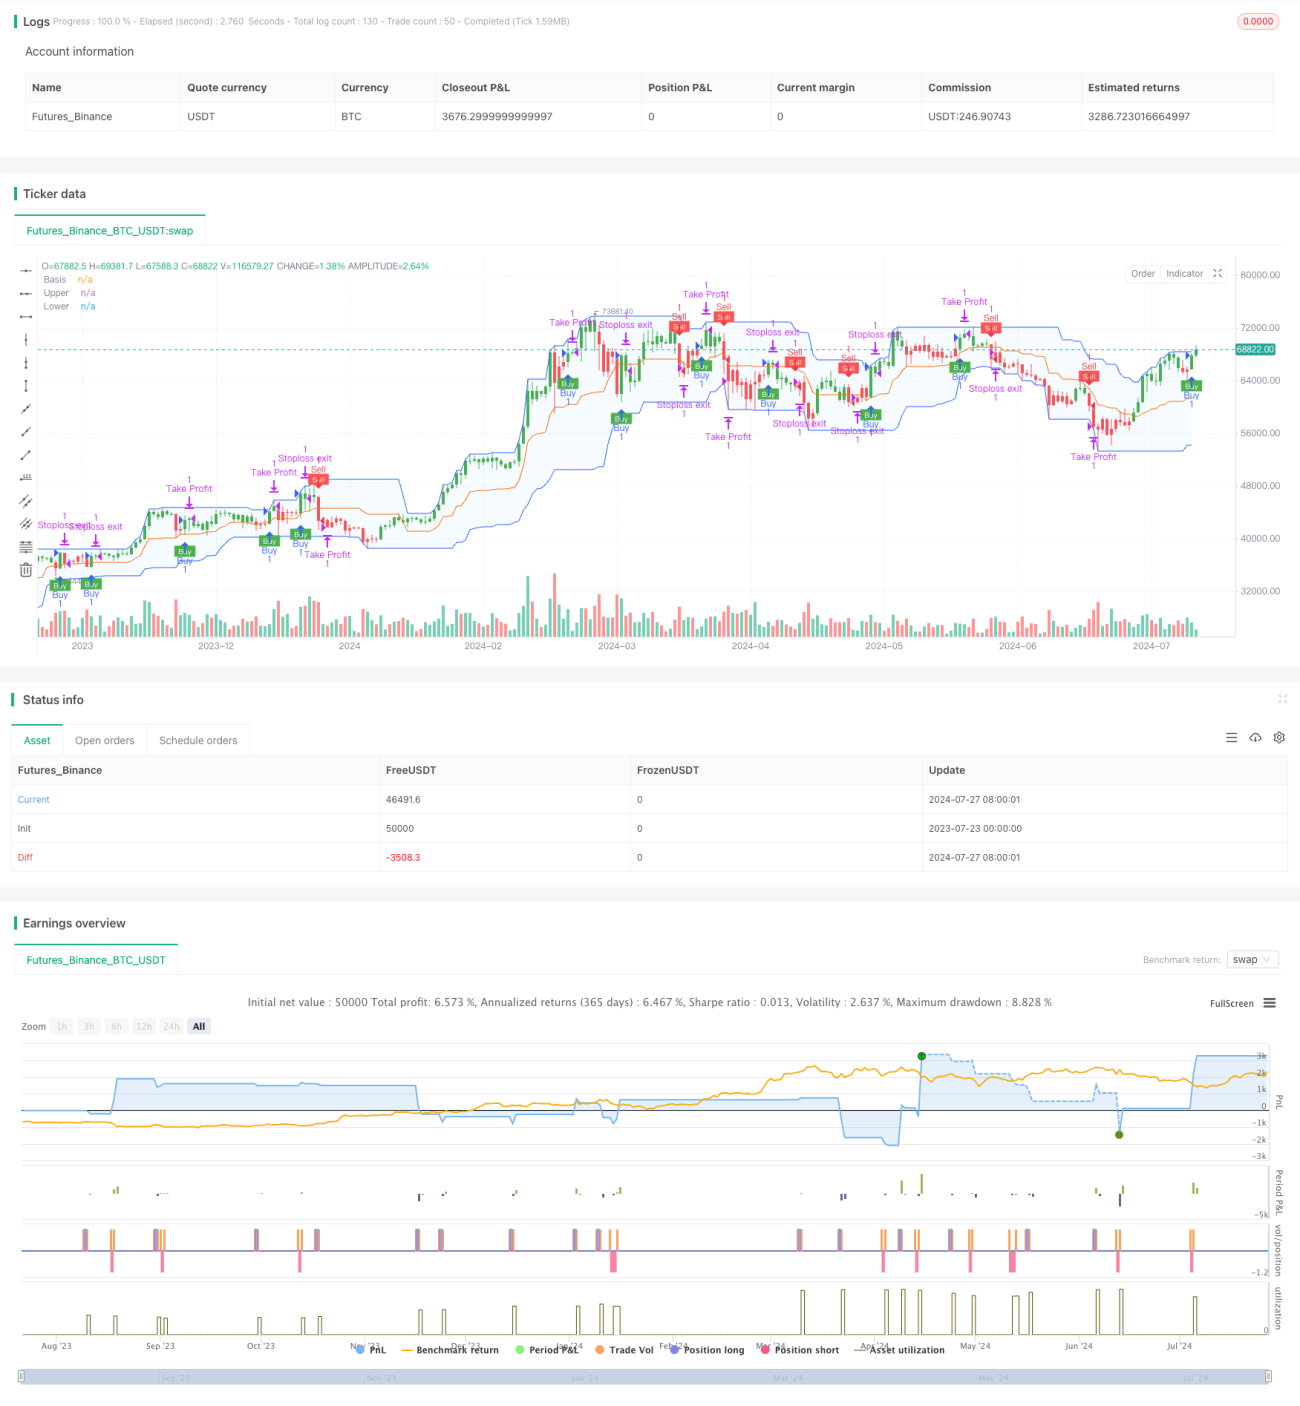
이것은 여러 기술 지표들을 결합한 자기 적응 트렌드 추적 전략이다. 이 전략은 UT Bot 경보 시스템, 상대적으로 약한 지표들 (RSI) 필터, ATR 추적 스톱를 재배치하지 않는, 그리고 돈치안 채널 (Donchian Channel) 을 통합한다. 이 전략은 15분 시간 프레임을 채택하고, 위킹-아시 (Heikin Ashi) 도표를 이용하여 신호 정확성을 높이고, 비율에 기반한 탈퇴 목표를 설정한다.
이 전략의 핵심은 다중 지표 협동으로 시장 추세를 식별하고 추적하는 동시에 유연한 위험 관리 장치를 제공하는 것입니다. 그것은 동력 (RSI), 변동성 (ATR) 및 추세 (동치안 채널) 과 같은 여러 차원의 시장 정보를 결합하여 보다 포괄적이고 안정적인 거래 결정을 수행합니다.
ATR 추적 스톱: 평균 실제 파장 ((ATR) 을 사용하여 동적 스톱 레벨을 계산하여 적응형 위험 제어를 제공합니다.
RSI 필터: 상대적으로 약한 지표 ((RSI) 를 사용하여 트렌드 방향을 확인하고 입시 신호의 신뢰성을 향상시킵니다.
동천 통로: 추가적인 트렌드 확인 도구로서, 전체 시장의 방향을 파악하는 데 도움을 줍니다.
입장 조건:
탈퇴 메커니즘: 수익 목표와 Stop Loss 레벨의 비율을 설정합니다.
선택 가능한 위킨-아치 : 가격 데이터를 평형화하여 잘못된 신호를 줄이기 위해 사용된다.
다차원 분석: 트렌드, 동력 및 변동성 지표와 결합하여 포괄적인 시장 통찰력을 제공합니다.
자기 적응력: ATR 추적 중지 손실은 시장의 변동에 따라 자동으로 조정되어 다른 시장 환경에 적응합니다.
리스크 관리: 명확한 스톱로스 및 수익 목표, 효과적인 리스크 제어.
신호 품질 향상: RSI와 동천 통로의 이중 확인을 통해 가짜 신호를 줄인다.
유연성: 위킨-아쉬 도표를 선택하여 다른 거래 스타일에 적응할 수 있습니다.
다시 그리지 않는다: ATR 추적의 손실 계산은 신호의 신뢰성과 일관성을 보장한다.
흔들림 시장의 성능:横盘 또는 흔들림 시장에서 빈번한 거짓 신호가 발생할 수 있다.
지연성: 복수의 인증 메커니즘으로 인해 입학 시기가 약간 늦어질 수 있습니다.
과도한 최적화 위험: 변수가 많고, 과도한 역사 데이터 일치로 이어질 수 있다.
시장 환경 의존성: 급격한 시장 변동에 반응하지 않을 수 있다.
실행 지점: 비율을 기반으로 하는 탈퇴는 매우 변동적인 시장에서 실행에 도전할 수 있다.
동적 변수 조정: 핵심 변수 (RSI 미지수, ATR 배수 등) 의 자동 최적화를 구현한다.
시장 체제 식별: 다양한 시장 상태에 대한 판단을 높이고, 동적 조정 전략을 수립한다.
시간 프레임 협동: 여러 시간 프레임의 신호를 결합하여 의사 결정의 안정성을 향상시킵니다.
변동율 필터: 매우 낮은 변동율 환경에서 거래를 중지하여 무효 신호를 피한다.
탈퇴 메커니즘 강화: 트레일링 스톱 또는 시간 기반 탈퇴 규칙을 도입하고 수익 관리를 최적화하십시오.
거래량 분석: 거래량 지표를 결합하여 트렌드 강도를 더욱 확인합니다.
기계 학습 통합: 기계 학습 알고리즘을 사용하여 파라미터 선택 및 신호 생성을 최적화한다.
이 다중 지표 융합의 자기 적응 트렌드 추적 전략은 정량 거래에서 체계화 및 다차원 분석의 장점을 보여줍니다. ATR, RSI, UT Bot 및 둥치안 통로와 같은 여러 지표를 통합함으로써 전략은 시장 동력을 다양한 각도에서 포착하여 비교적 포괄적이고 안정적인 거래 신호를 제공합니다.
그러나, 전략의 복잡성은 또한 과도한 적합성과 변수 민감성 같은 잠재적인 위험을 가져옵니다. 미래 최적화 방향은 전략의 적응성과 거친성을 향상시키는 데 초점을 맞추어야합니다. 동적 변수 조정, 시장 상태 인식과 같은 고급 기능을 도입하는 것과 같은 것입니다. 동시에, 전략의 간결성과 해석성을 유지하는 데 주의를 기울여야 하며, 과도한 복잡성으로 인한 안정성 저하를 피해야합니다.
종합적으로, 이 전략은 트렌드 추적에 대한 포괄적이고 통찰력있는 프레임워크를 제공하며, 지속적인 최적화와 신중한 적용을 통해 효과적인 거래 도구가 될 잠재력을 가지고 있습니다.
/*backtest
start: 2023-07-23 00:00:00
end: 2024-07-28 00:00:00
period: 1d
basePeriod: 1h
exchanges: [{"eid":"Futures_Binance","currency":"BTC_USDT"}]
*/
//@version=5
strategy("UT Bot Alerts - Non-Repainting with RSI Filter and Donchian Channels", overlay=true)
// Inputs for UT Bot
a = input.int(1, title="Key Value. 'This changes the sensitivity'")
c = input.int(10, title="ATR Period")
h = input.bool(false, title="Signals from Heikin Ashi Candles")
percentage = input.float(0.002, title="Percentage for Exit (0.2% as decimal)")
// RSI Inputs
rsiPeriod = input.int(14, title="RSI Period")
rsiSource = input.source(close, title="RSI Source")
// ATR Calculation
xATR = ta.atr(c)
nLoss = a * xATR
// Heikin Ashi Calculation
haClose = request.security(syminfo.tickerid, timeframe.period, close, lookahead=barmerge.lookahead_on)
haOpen = request.security(syminfo.tickerid, timeframe.period, open, lookahead=barmerge.lookahead_on)
haHigh = request.security(syminfo.tickerid, timeframe.period, high, lookahead=barmerge.lookahead_on)
haLow = request.security(syminfo.tickerid, timeframe.period, low, lookahead=barmerge.lookahead_on)
haCloseSeries = (haOpen + haHigh + haLow + haClose) / 4
src = h ? haCloseSeries : close
// RSI Calculation
rsiValue = ta.rsi(rsiSource, rsiPeriod)
// Non-repainting ATR Trailing Stop Calculation
var float xATRTrailingStop = na
if (barstate.isconfirmed)
xATRTrailingStop := src > nz(xATRTrailingStop[1], 0) and src[1] > nz(xATRTrailingStop[1], 0) ? math.max(nz(xATRTrailingStop[1]), src - nLoss) : src < nz(xATRTrailingStop[1], 0) and src[1] < nz(xATRTrailingStop[1], 0) ? math.min(nz(xATRTrailingStop[1]), src + nLoss) : src > nz(xATRTrailingStop[1], 0) ? src - nLoss : src + nLoss
// Position Calculation
var int pos = 0
if (barstate.isconfirmed)
pos := src[1] < nz(xATRTrailingStop[1], 0) and src > nz(xATRTrailingStop[1], 0) ? 1 : src[1] > nz(xATRTrailingStop[1], 0) and src < nz(xATRTrailingStop[1], 0) ? -1 : nz(pos[1], 0)
xcolor = pos == -1 ? color.red : pos == 1 ? color.green : color.blue
ema = ta.ema(src, 1)
above = ta.crossover(ema, xATRTrailingStop)
below = ta.crossover(xATRTrailingStop, ema)
// Track entry prices
var float entryPrice = na
// Donchian Channels
length = input.int(20, minval = 1, title="Donchian Channels Length")
offset = input.int(0, title="Donchian Channels Offset")
lower = ta.lowest(length)
upper = ta.highest(length)
basis = math.avg(upper, lower)
plot(basis, "Basis", color = #FF6D00, offset = offset)
u = plot(upper, "Upper", color = #2962FF, offset = offset)
l = plot(lower, "Lower", color = #2962FF, offset = offset)
fill(u, l, color = color.rgb(33, 150, 243, 95), title = "Background")
// Buy and sell conditions with RSI filter and basis condition
buy = src > xATRTrailingStop and above and barstate.isconfirmed and rsiValue > 50 and src > basis
sell = src < xATRTrailingStop and below and barstate.isconfirmed and rsiValue < 50 and src < basis
// Calculate target prices for exit
var float buyTarget = na
var float sellTarget = na
if (buy)
entryPrice := src
buyTarget := entryPrice * (1 + percentage)
sellTarget := entryPrice * (1 - percentage)
strategy.entry("Buy", strategy.long)
if (sell)
entryPrice := src
buyTarget := entryPrice * (1 + percentage)
sellTarget := entryPrice * (1 - percentage)
strategy.entry("Sell", strategy.short)
// Exit conditions
var bool buyExit = false
var bool sellExit = false
var bool stopLossExit = false
if (strategy.position_size > 0 and barstate.isconfirmed)
if (src >= buyTarget)
strategy.exit("Take Profit", "Buy", limit=buyTarget)
buyExit := true
if (src <= sellTarget)
strategy.exit("Stoploss exit", "Buy", stop=src)
stopLossExit := true
if (strategy.position_size < 0 and barstate.isconfirmed)
if (src <= sellTarget)
strategy.exit("Take Profit", "Sell", limit=sellTarget)
sellExit := true
if (src >= buyTarget)
strategy.exit("Stoploss exit", "Sell", stop=src)
stopLossExit := true
// Plotting
plotshape(buy, title="Buy", text='Buy', style=shape.labelup, location=location.belowbar, color=color.green, textcolor=color.white, size=size.tiny)
plotshape(sell, title="Sell", text='Sell', style=shape.labeldown, location=location.abovebar, color=color.red, textcolor=color.white, size=size.tiny)
barcolor(src > xATRTrailingStop ? color.green : na)
barcolor(src < xATRTrailingStop ? color.red : na)
alertcondition(buy, "UT Long", "UT Long")
alertcondition(sell, "UT Short", "UT Short")
alertcondition(buyExit, "UT Long Exit", "UT Long Exit")
alertcondition(sellExit, "UT Short Exit", "UT Short Exit")
alertcondition(stopLossExit, "Stoploss exit", "Stoploss exit")