다중 지표 조합 옵션 거래 전략

1
Follow
1781
Followers
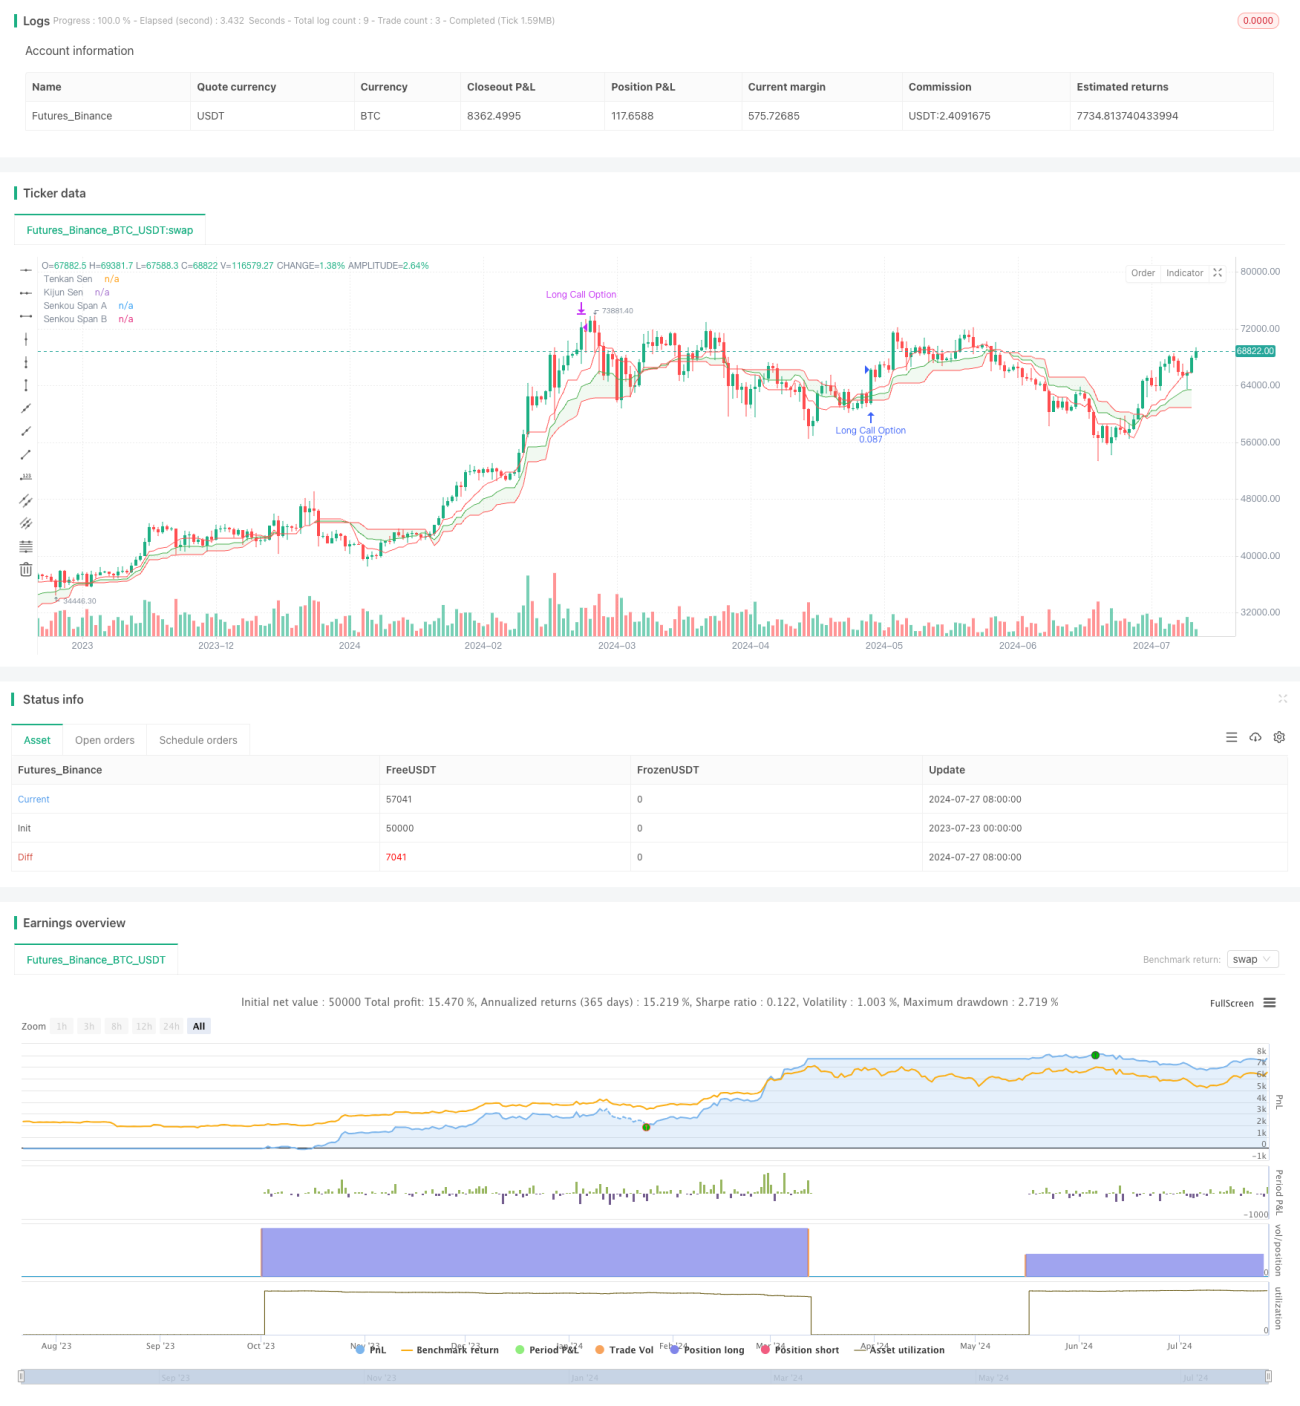
이 전략은 여러 기술 지표를 기반으로 한 옵션 거래 전략으로, 시장 추세와 동력 지표를 결합하여 잠재적인 거래 기회를 식별합니다. 전략은 1 분 차트에서 가격과 클라우드 그래프의 상대적인 위치, RSI 과잉 구매 조건 및 MACD 및 KST 지표의 황소 시장 교차를 사용하여 거래 신호를 유발합니다. 모든 조건이 충족되면 전략은 다중 옵션으로 포지션을 열고 30%의 수익 목표가 달성되면 포지션을 청산합니다.
전략 원칙
-
입학 조건:
- 하향에서 초록색으로 이동하는 가격
- RSI가 70보다 낮으면 과잉 구매를 피합니다.
- MACD 라인을 통해 신호 라인을 통과
- KST 선에서 신호선을 통과
-
출전 조건:
- 30%의 수익 목표에 도달
이 전략은 전체적인 추세를 확인하기 위해 이치모쿠 클라우드 그래프를 사용하며, RSI는 과도한 과매매 시 입장을 피하고, MACD와 KST 지표의 교차는 단기적인 동력을 확인하기 위해 사용된다. 이러한 다중 확인 메커니즘은 거래 신호의 신뢰성을 높이기 위해 사용된다.
전략적 이점
- 다중 확인: 여러 기술 지표와 결합하여 잘못된 신호의 위험을 낮춘다.
- 트렌드 추적: 이치모쿠 클라우드 지도를 사용하여 트렌드 변화를 캡처하십시오.
- 동력 확인: MACD와 KST 교차는 추가 동력 확인을 제공한다.
- 위험 관리: RSI를 사용하여 과도한 과매매를 피하십시오.
- 명확한 수익 목표: 30%의 수익 목표가 명확한 탈퇴 전략을 제공합니다.
- 적응성: 다른 시장 조건에 따라 매개 변수를 조정할 수 있다.
전략적 위험
- 과도한 거래: 빈번한 단기 거래는 높은 거래 비용을 초래할 수 있습니다.
- 큰 트렌드를 놓친 것: 고정된 30% 수익 목표가 강세를 조기 종료시킬 수 있다.
- 슬라이드 포인트 위험: 빠른 시장에서, 이상적인 가격으로 거래를 실행할 수 없습니다.
- 매개 변수 민감성: 정책의 성능은 매개 변수 설정에 매우 민감할 수 있다.
- 시장 조건의 변화: 다른 시장 환경에서 전략 효과는 크게 달라질 수 있습니다.
전략 최적화 방향
- 동적 정지: 다른 시장 조건에 적응하기 위해 트래킹 스톱 또는 변동성에 기반한 동적 정지를 사용하는 것을 고려하십시오.
- 시간 필터: 거래 시간 창을 제한하여 변동성이 높은 시간에 거래하는 것을 피하십시오.
- 변동율 조정: 시장 변동율에 따라 진입 및 출구 조건을 조정한다.
- 다중 시간 프레임 분석: 더 긴 시간 주기의 분석과 결합하여 거래 결정의 신뢰성을 향상시킵니다.
- 머신러닝 최적화: 머신러닝 알고리즘을 사용하여 파라미터 선택과 신호 생성 최적화.
요약하다
이 다중 지표 옵션 거래 전략은 이치모쿠 클라우드 그래프, RSI, MACD 및 KST 지표를 결합하여 단기 거래에 대한 포괄적 인 프레임 워크를 제공합니다. 전략은 다중 확인 메커니즘과 명확한 위험 관리 규칙이 있지만, 거래자가 신중하게 사용하고 지속적으로 그 성능을 모니터링해야합니다. 추가 최적화 및 재검토를 통해 전략은 효과적인 단기 거래 도구가 될 잠재력을 가지고 있습니다. 그러나 사용자는 시장 조건의 변화가 전략의 성능에 미치는 영향에 주의를 기울이고 실제 거래 결과에 따라 필요한 조정을 준비해야합니다.
Source
Pine
/*backtest
start: 2023-07-23 00:00:00
end: 2024-07-28 00:00:00
period: 1d
basePeriod: 1h
exchanges: [{"eid":"Futures_Binance","currency":"BTC_USDT"}]
*/

//@version=5
strategy("Ichimoku + RSI + MACD + KST Options Strategy", overlay=true, default_qty_type=strategy.percent_of_equity, default_qty_value=10)

// Ichimoku Cloud settingsStrategy parameters
Related strategies
Comment
All comments (0)
No data
- 1