3기간 고점-저점 모멘텀 트레이딩 전략

개요
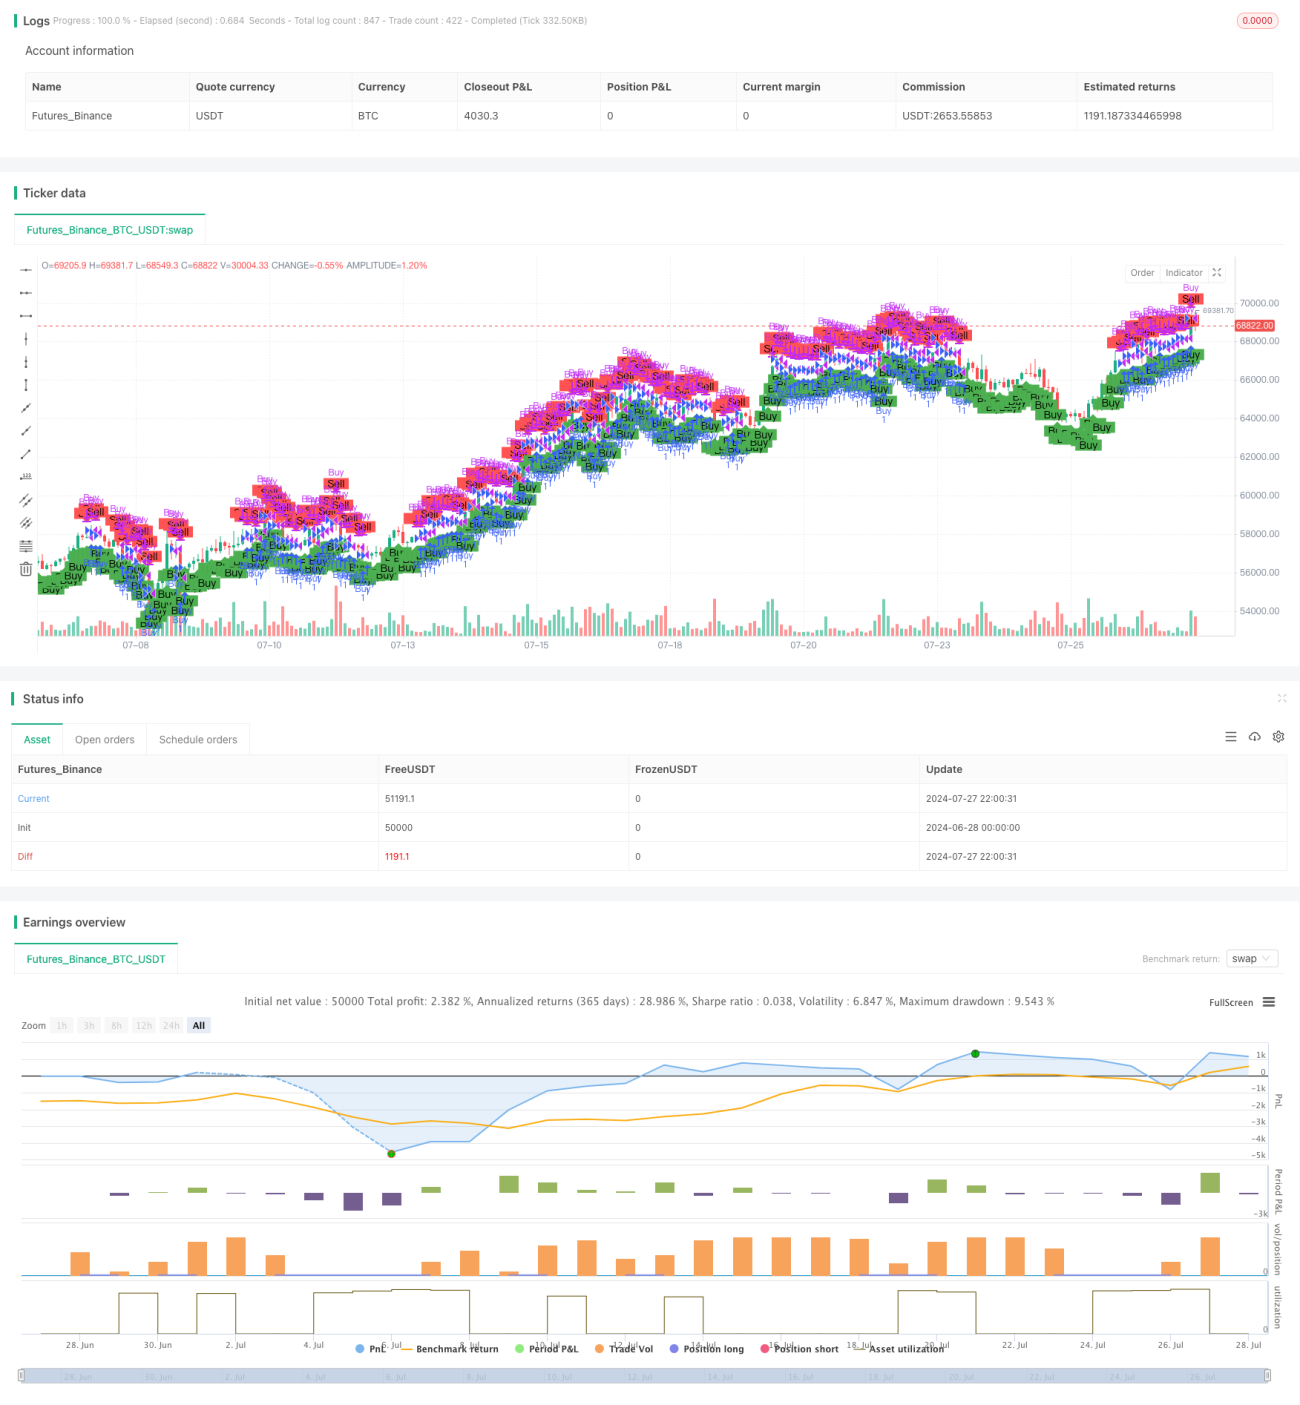
이 전략은 3주기 높고 낮은 시기를 기반으로 한 동적 거래 전략이다. 최근 3주간의 가격 데이터를 사용하여 잠재적인 구매 및 판매 기회를 식별한다. 이 전략은 주로 최신의 높고 최신의 종결 가격과 3주 전의 종결 가격 사이의 관계에 초점을 맞추고, 이러한 가격 수준을 비교하여 거래 신호를 생성한다. 이 방법은 중기 가격 흐름을 포착하면서 단기 시장 소음의 영향을 피하기 위해 고안되었습니다.
전략 원칙
이 전략의 핵심에는 다음과 같은 핵심 요소들이 포함되어 있습니다.
-
계산된 지표:
- 최신 최고점: ta.highest () 함수를 사용하여 최근 30 거래일 (~ 4 주) 의 최고 가격을 계산한다.
- 최신 종식 가격: close 사용[1] 전날의 종식 가격을 얻는다.
- 3주 전 종전 가격: close를 사용함[30] 30 거래일 전의 종식 가격을 얻으십시오.
-
구매 조건:
- 조건 1: 최근 최고점은 3주 전의 종식 가격보다 크거나 같다는 것.
- 조건 2: 최신 매출액이 3주 전 매출액보다 크다.
-
판매 조건:
- 판매 신호는 최근 종결 가격이 3주 전의 종결 가격보다 높을 때 발동됩니다.
-
거래 실행:
- 구매 신호가 터지면, 실행에 더 많은 입장이 됩니다.
- 판매 신호가 발동되면, 평점 상태는 현재 상위 포지션을 종료한다.
-
시각화:
- 플롯셰이프 () 함수를 사용하여 차트에 구매 및 판매 신호를 표시하십시오.
이 디자인은 가격이 3주 전의 수준을 돌파했을 때 상승 동력을 포착하고, 가격이 다시 떨어질 때 적당히 평준화하여 이익을 보호하기 위한 것이다.
전략적 이점
-
중기 트렌드 캡처: 현재 가격과 3주 전 가격 수준을 비교하여 중기 트렌드의 형성 및 지속을 효과적으로 식별할 수 있다.
-
노이즈 필터: 3주기의 시간 프레임은 단기 시장의 변동을 필터링하여 신호의 신뢰성을 높이는 데 도움이됩니다.
-
동적 적응: 전략은 최신 가격 데이터에 따라 판단 기준을 지속적으로 업데이트하여 시장 변화에 동적으로 적응할 수 있습니다.
-
위험 관리: 명확한 판매 조건을 설정함으로써, 전략은 시장이 변할 때 적시에 포지션을 청산하여 위험을 효과적으로 제어 할 수 있습니다.
-
간단하고 이해하기 쉽다: 전략 논리는 직관적이고, 이해하기 쉽고, 실행하기 쉬우며, 초보자와 경험이 많은 거래자에게 적합하다.
-
시각화 지원: 차트에 명확하게 표시된 매매 신호를 통해 거래자가 직관적으로 판단하고 반향 분석을 할 수 있다.
전략적 위험
-
가짜 브레이크 위험: 상반기 시장에서 빈번한 가짜 브레이크가 발생하여 과도한 거래와 불필요한 수수료 손실이 발생할 수 있습니다.
-
지연성: 3주기 역사 데이터를 사용하면 신호가 지연되어 빠르게 변화하는 시장에서 최적의 진입 시기를 놓칠 수 있습니다.
-
단일 시간 프레임의 한계: 3주기에만 의존하는 데이터는 다른 시간 프레임의 중요한 시장 정보를 무시할 수 있습니다.
-
스톱 로드 장치의 부재: 현재 전략에는 명확한 스톱 로드 장치가 없으며, 시장이 급격하게 변동할 때 큰 손실을 입을 수 있습니다.
-
과도한 종결 가격 의존: 전략은 주로 종결 가격에 근거하여 판단하고, 종결 가격의 중요한 가격 변화를 무시할 수 있다.
-
거래량 확인 부족: 거래량 요소가 고려되지 않아 낮은 거래량 기간에 잘못된 신호가 발생할 수 있습니다.
전략 최적화 방향
-
다중 시간 프레임 분석: 더 포괄적인 시장 관점을 제공하기 위해 일선, 주선 및 달선과 같은 여러 시간 프레임의 데이터를 통합합니다.
-
트래픽 지표 도입: 트래픽 분석을 결합하여 신호의 신뢰성을 향상시킬 수 있습니다. 특히 브레이크 확인의 측면에서.
-
다이내믹 스톱 메커니즘: 트래킹 스톱이나 ATR 기반의 스톱과 같은 적응형 스톱 전략을 적용하여 위험을 더 잘 관리합니다.
-
신호 필터: 가짜 신호를 줄이기 위해 RSI 또는 MACD와 같은 추가 기술 지표 또는 시장 감정 지표를 추가합니다.
-
진입 최적화: 시장 가격에 직접 진입하지 않고 제한 가격 또는 관찰 범위를 사용하여 더 나은 거래 가격을 얻으십시오.
-
포지션 관리: 동적 포지션 관리 전략을 구현하고, 시장의 변동성과 계정 위험에 따라 매 거래의 포지션 크기를 조정한다.
-
시장 상태 식별: 시장 상태 ((트렌드, 평형, 높은 변동) 를 포함하는 식별 논리, 다른 시장 환경에서 다른 거래 매개 변수를 사용합니다.
-
회수 및 최적화: 많은 양의 역사 데이터를 회수하고, 시간 주기와 조건 절댓값 등과 같은 전략 매개 변수를 최적화한다.
요약하다
3주기 고저동력 거래 전략은 간단하고 효과적인 중기 트렌드 추적 방법이다. 최신 고지, 최신 종식 가격과 3주 전 종식 가격을 비교함으로써, 전략은 가격 돌파구와 동력 변화를 포착할 수 있다. 이 전략의 장점은 단기간의 소음을 필터링하고 중기 트렌드를 포착할 수 있다는 점이며, 논리는 쉽게 이해할 수 있다. 그러나, 전략은 가짜 돌파구, 신호 지연 및 위험 관리 부족과 같은 도전에 직면한다.
미래 최적화 방향은 다중 시간 프레임 분석, 거래량 확인, 동적 위험 관리 및 시장 상태 식별 등의 측면을 고려해야합니다. 이러한 개선으로, 전략은 다양한 시장 환경에서 더 안정적으로 작동하고 거래자에게 더 신뢰할 수있는 의사 결정 지원을 제공 할 것으로 예상됩니다.
전체적으로, 이 전략은 양적 거래에 좋은 출발점을 제공하며, 지속적인 최적화와 개선을 통해 강력한 거래 도구가 될 잠재력을 가지고 있다. 그러나, 투자자는 실제 적용 시 신중하고 시장 위험을 충분히 알고, 자신의 위험 용량과 투자 목표와 결합하여 이 전략을 사용해야 한다.
Overview
This strategy is a momentum trading approach based on three-week high and low points. It utilizes price data from the recent three weeks to identify potential buying and selling opportunities. The strategy primarily focuses on the relationship between the latest high, the latest closing price, and the closing price from three weeks ago, generating trading signals by comparing these price levels. This method aims to capture medium-term price trends while avoiding the impact of short-term market noise.
Strategy Principle
The core principles of this strategy include the following key elements:
-
Indicator Calculations:
- Latest High: Uses the ta.highest() function to calculate the highest price over the last 30 trading days (approximately 4 weeks).
- Latest Close: Uses close[1] to get the closing price of the previous day.
- Three Weeks Ago Close: Uses close[30] to get the closing price from 30 trading days ago.
-
Buy Conditions:
- Condition 1: The latest high is greater than or equal to the closing price from three weeks ago.
- Condition 2: The latest closing price is greater than the closing price from three weeks ago.
-
Sell Condition:
- Triggers a sell signal when the latest closing price is greater than the closing price from three weeks ago.
-
Trade Execution:
- Enters a long position when the buy signal is triggered.
- Closes the current long position when the sell signal is triggered.
-
Visualization:
- Uses the plotshape() function to mark buy and sell signals on the chart.
This design aims to capture upward momentum when the price breaks above the level from three weeks ago, while promptly closing positions to protect profits when the price falls back.
Strategy Advantages
-
Medium-Term Trend Capture: By comparing current prices with levels from three weeks ago, the strategy effectively identifies the formation and continuation of medium-term trends.
-
Noise Filtering: Using a three-week time frame helps filter out short-term market fluctuations, improving the reliability of signals.
-
Dynamic Adaptation: The strategy continuously updates its decision criteria based on the latest price data, allowing it to dynamically adapt to market changes.
-
Risk Management: Through clear sell conditions, the strategy can close positions promptly when the market turns, effectively controlling risk.
-
Simple and Understandable: The strategy logic is intuitive, easy to understand and implement, suitable for both novice and experienced traders.
-
Visual Support: Buy and sell signals are clearly marked on the chart, facilitating intuitive judgment and backtesting analysis for traders.
Strategy Risks
-
False Breakout Risk: In sideways markets, frequent false breakouts may occur, leading to excessive trading and unnecessary transaction fee losses.
-
Lagging Nature: Using historical data from three weeks may result in lagging signals, potentially missing optimal entry points in rapidly changing markets.
-
Single Time Frame Limitation: Relying solely on three-week data may overlook important market information from other time frames.
-
Lack of Stop-Loss Mechanism: The current strategy lacks a clear stop-loss mechanism, potentially facing significant losses during severe market fluctuations.
-
Over-reliance on Closing Prices: The strategy mainly bases its judgments on closing prices, potentially ignoring important intraday price movements.
-
Lack of Volume Confirmation: Not considering volume factors may lead to false signals during periods of low trading volume.
Strategy Optimization Directions
-
Multi-Time Frame Analysis: Integrate data from multiple time frames, such as daily, weekly, and monthly, to provide a more comprehensive market perspective.
-
Incorporate Volume Indicators: Combining volume analysis can improve signal reliability, especially in breakout confirmation.
-
Dynamic Stop-Loss Mechanism: Implement adaptive stop-loss strategies, such as trailing stops or ATR-based stops, for better risk management.
-
Signal Filters: Add additional technical or market sentiment indicators, like RSI or MACD, to reduce false signals.
-
Entry Optimization: Consider using limit orders or observation zones instead of direct market orders for entry to obtain better execution prices.
-
Position Management: Implement dynamic position sizing strategies, adjusting the size of each trade based on market volatility and account risk.
-
Market State Recognition: Add logic to identify market states (trending, ranging, high volatility) and adopt different trading parameters for different market environments.
-
Backtesting and Optimization: Conduct extensive historical data backtesting to optimize strategy parameters such as time periods and condition thresholds.
Summary
The Three-Week High-Low Momentum Trading Strategy is a simple yet effective method for medium-term trend following. By comparing the latest high, latest close, and the closing price from three weeks ago, the strategy can capture price breakouts and momentum changes. Its strengths lie in filtering short-term noise, capturing medium-term trends, and its simple, easy-to-understand logic. However, the strategy also faces challenges such as false breakouts, signal lag, and insufficient risk management.
Future optimization directions should focus on multi-time frame analysis, volume confirmation, dynamic risk management, and market state recognition. Through these improvements, the strategy has the potential to perform more robustly in different market environments, providing traders with more reliable decision support.
Overall, this strategy provides a good starting point for quantitative trading. With continuous optimization and refinement, it has the potential to become a powerful trading tool. However, investors should be cautious when applying it in practice, fully recognizing market risks and using the strategy in conjunction with their own risk tolerance and investment objectives.
- 1