
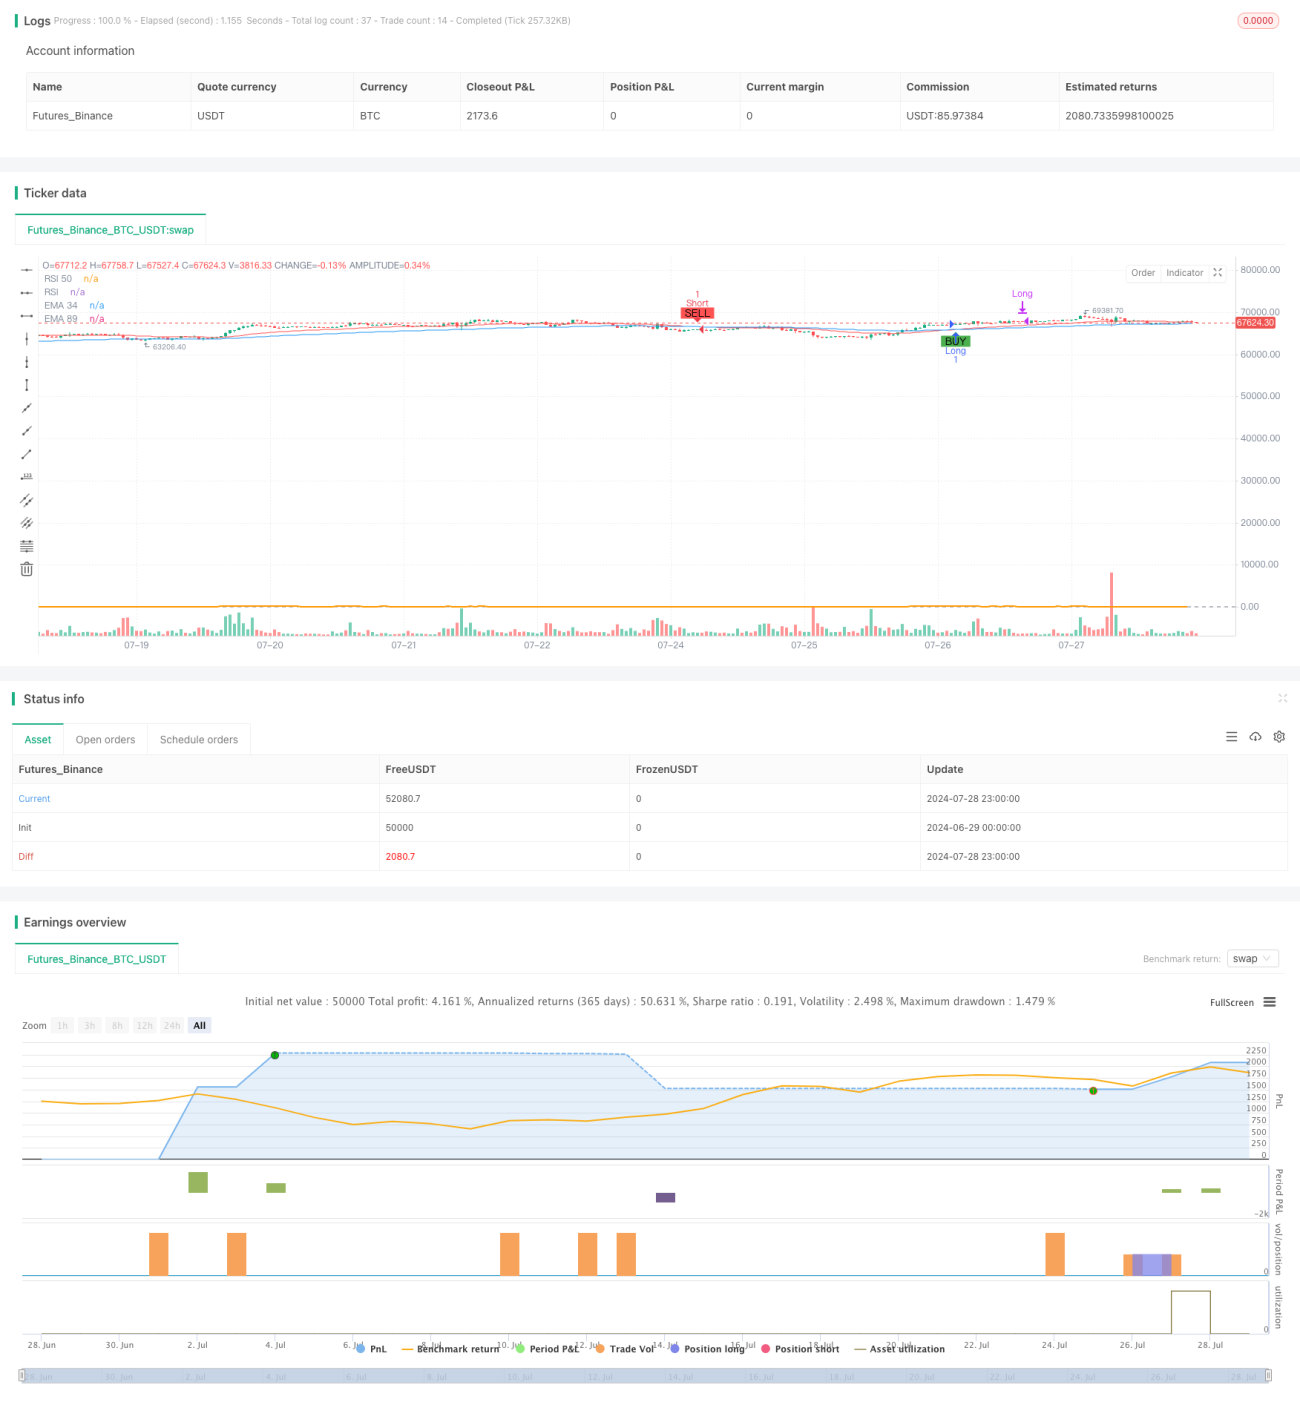
이 전략은 여러 기술적 지표를 기반으로 한 통합 거래 시스템으로, 주로 지수 이동 평균 ((EMA), 상대적으로 강한 지수 ((RSI) 와 거래량을 사용하여 거래 신호를 생성하고 포지션을 관리한다. 이 전략은 EMA를 통해 시장 추세를 결정하며 RSI 지수를 사용하여 초과 판매를 판단하고 거래량과 결합하여 신호 강도를 확인한다. 또한, 전략에는 동적 스톱 손실 장치와 고정 포지션 보유 시간 제한이 포함되어있어 위험을 제어하고 거래 성능을 최적화한다.
거래 신호 생성:
동적 정지 손실:
고정 포지션 보유 기간:
EMA 상쇄:
거래량 확인:
다중 지표 연동: EMA, RSI 및 거래량과 결합하여 시장 상황을 종합적으로 분석하여 신호 신뢰도를 높인다.
동적 리스크 관리: 시장의 변동에 따라 실시간으로 정지 손실을 조정하여 다른 시장 환경에 적응합니다.
고정 포지션 보유 시간: 장기 포지션의 위험을 피하고 거래 당 노출 시간을 제어하십시오.
EMA 다이내믹 스톱: 동적 지원 저항으로 평행선을 사용하여 더 유연한 스톱 보호를 제공합니다.
거래량 확인: 거래량 돌파구를 사용하여 신호 강도를 확인하고 거래의 정확성을 향상시킵니다.
시각적 도움말: 거래 신호와 중요한 가격 수준을 그래프에 표시하여 분석과 의사 결정에 도움이 됩니다.
흔들림 시장의 위험: 가로 수평 흔들림 시장에서, EMA 교차는 자주 잘못된 신호를 생성할 수 있다.
RSI 마이너스 고정: 고정된 RSI 마이너스는 모든 시장 환경에 적용되지 않을 수 있습니다.
거래량 하락 민감성: 평균 거래량의 3배의 하락값이 너무 높거나 너무 낮을 수 있으며, 특정 시장에 따라 조정해야 한다.
고정 위치 보유 시간 제한: 15 K 선의 고정 평지 시간은 수익 거래의 조기 종료로 이어질 수 있다.
스톱스트로스 가격 설정: 높은 거래량이 발생했을 때 클로즈오프 가격이 스톱스트로스 가격으로 충분히 최적화되지 않을 수 있다.
동적 RSI 마이너스: 시장의 변동성에 따라 RSI의 오버 구매 오버 판매 마이너스를 자동으로 조정합니다.
거래량 저하를 최적화: 적응 메커니즘을 도입하여 거래량이 역사 데이터에 따라 동적으로 조정됩니다.
포지션 보유 시간 관리를 개선: 트렌드 강도와 수익 상황을 결합하여 최대 포지션 보유 시간을 동적으로 조정하십시오.
최적화 스톱 스톱 손실 설정: ATR 지표를 도입하여 시장의 변동성에 따라 스톱 스톱 손실 가격을 설정하는 것을 고려하십시오.
트렌드 필터를 추가: 장기 EMA 또는 트렌드 지표를 도입하여 주요 트렌드에 반대되는 방향으로 거래하는 것을 피하십시오.
가격행동 분석을 도입: K선 형태와 지지 저항 수준을 결합하여 진입 및 출입의 정확성을 향상시킨다.
철수 제어: 최대 철수 제한을 설정하고 특정 철수 수준에 도달하면 필리핀을 강제하는 것을 고려하십시오.
이 다중 지표 포괄형 동적 거래 전략은 EMA, RSI 및 거래량을 결합하여 포괄적인 거래 시스템을 만듭니다. 그것은 시장 추세를 포착할 수 있을 뿐만 아니라 동적 정지 손실 및 고정 지점 시간을 통해 위험을 관리할 수 있습니다. 전략의 장점은 다차원 분석과 유연한 위험 관리에 있습니다. 그러나 동시에 시장 환경의 변화에 따른 도전에 직면합니다.
/*backtest
start: 2024-06-29 00:00:00
end: 2024-07-29 00:00:00
period: 1h
basePeriod: 15m
exchanges: [{"eid":"Futures_Binance","currency":"BTC_USDT"}]
*/
//@version=5
strategy("EMA & RSI Strategy", overlay=true)
// Install indicators
ema34 = ta.ema(close, 34)
ema89 = ta.ema(close, 89)
ema54 = ta.ema(close, 54)
ema150 = ta.ema(close, 150)
rsi = ta.rsi(close, 14)
// Draw indicator
plot(ema34, color=color.red, title="EMA 34")
plot(ema89, color=color.blue, title="EMA 89")
//plot(ema54, color=color.green, title="EMA 54")
//plot(ema150, color=color.yellow, title="EMA 150")
hline(50, "RSI 50", color=color.gray)
plot(rsi, title="RSI", color=color.orange, linewidth=2, offset=-1)
// condition long or short
longCondition = ta.crossover(ema34, ema89) and rsi > 30
shortCondition = ta.crossunder(ema34, ema89) and rsi < 70
// Add strategy long
if (longCondition)
strategy.entry("Long", strategy.long)
// Add strategy short
if (shortCondition)
strategy.entry("Short", strategy.short)
// Calculate the average volume of previous candles
length = 20 // Number of candles to calculate average volume
avgVolume = ta.sma(volume, length)
highVolumeCondition = volume > 3 * avgVolume
// Determine take profit and stop loss prices when there is high volume
var float takeProfitPriceLong = na
var float stopLossPriceLong = na
var float takeProfitPriceShort = na
var float stopLossPriceShort = na
if (longCondition)
takeProfitPriceLong := na
stopLossPriceLong := na
if (shortCondition)
takeProfitPriceShort := na
stopLossPriceShort := na
// Update take profit and stop loss prices when volume is high
if (strategy.opentrades.entry_id(0) == "Long" and highVolumeCondition)
takeProfitPriceLong := close
stopLossPriceLong := close
if (strategy.opentrades.entry_id(0) == "Short" and highVolumeCondition)
takeProfitPriceShort := close
stopLossPriceShort := close
// Execute exit orders for buy and sell orders when there is high volume
if (not na(takeProfitPriceLong))
strategy.exit("Take Profit Long", from_entry="Long", limit=takeProfitPriceLong, stop=stopLossPriceLong)
if (not na(takeProfitPriceShort))
strategy.exit("Take Profit Short", from_entry="Short", limit=takeProfitPriceShort, stop=stopLossPriceShort)
// Track the number of candles since the order was opened
var int barsSinceEntryLong = na
var int barsSinceEntryShort = na
var bool longPositionClosed = false
var bool shortPositionClosed = false
if (longCondition)
barsSinceEntryLong := 0
longPositionClosed := false
if (shortCondition)
barsSinceEntryShort := 0
shortPositionClosed := false
if (strategy.opentrades.entry_id(0) == "Long")
barsSinceEntryLong := barsSinceEntryLong + 1
if (strategy.opentrades.entry_id(0) == "Short")
barsSinceEntryShort := barsSinceEntryShort + 1
// Check the conditions to close the order at the 15th candle
if (strategy.opentrades.entry_id(0) == "Long" and barsSinceEntryLong >= 15 and not longPositionClosed)
strategy.close("Long")
longPositionClosed := true
if (strategy.opentrades.entry_id(0) == "Short" and barsSinceEntryShort >= 15 and not shortPositionClosed)
strategy.close("Short")
shortPositionClosed := true
// Thêm stop loss theo EMA34
if (strategy.opentrades.entry_id(0) == "Long")
strategy.exit("Stop Loss Long", from_entry="Long", stop=ema34)
if (strategy.opentrades.entry_id(0) == "Short")
strategy.exit("Stop Loss Short", from_entry="Short", stop=ema34)
// Displays buy/sell signals and price levels on the chart
plotshape(series=longCondition, location=location.belowbar, color=color.green, style=shape.labelup, text="BUY")
plotshape(series=shortCondition, location=location.abovebar, color=color.red, style=shape.labeldown, text="SELL")
// Displays take profit and stop loss prices on the chart
// var line takeProfitLineLong = na
// var line stopLossLineLong = na
// var line takeProfitLineShort = na
// var line stopLossLineShort = na
// if (not na(takeProfitPriceLong))
// if na(takeProfitLineLong)
// takeProfitLineLong := line.new(x1=bar_index, y1=takeProfitPriceLong, x2=bar_index + 1, y2=takeProfitPriceLong, color=color.blue, width=1, style=line.style_dashed)
// else
// line.set_xy1(takeProfitLineLong, x=bar_index, y=takeProfitPriceLong)
// line.set_xy2(takeProfitLineLong, x=bar_index + 1, y=takeProfitPriceLong)
// if (not na(stopLossPriceLong))
// if na(stopLossLineLong)
// stopLossLineLong := line.new(x1=bar_index, y1=stopLossPriceLong, x2=bar_index + 1, y2=stopLossPriceLong, color=color.red, width=1, style=line.style_dashed)
// else
// line.set_xy1(stopLossLineLong, x=bar_index, y=stopLossPriceLong)
// line.set_xy2(stopLossLineLong, x=bar_index + 1, y=stopLossPriceLong)
// if (not na(takeProfitPriceShort))
// if na(takeProfitLineShort)
// takeProfitLineShort := line.new(x1=bar_index, y1=takeProfitPriceShort, x2=bar_index + 1, y2=takeProfitPriceShort, color=color.blue, width=1, style=line.style_dashed)
// else
// line.set_xy1(takeProfitLineShort, x=bar_index, y=takeProfitPriceShort)
// line.set_xy2(takeProfitLineShort, x=bar_index + 1, y=takeProfitPriceShort)
// if (not na(stopLossPriceShort))
// if na(stopLossLineShort)
// stopLossLineShort := line.new(x1=bar_index, y1=stopLossPriceShort, x2=bar_index + 1, y2=stopLossPriceShort, color=color.red, width=1, style=line.style_dashed)
// else
// line.set_xy1(stopLossLineShort, x=bar_index, y=stopLossPriceShort)
// line.set_xy2(stopLossLineShort, x=bar_index + 1, y=stopLossPriceShort)
// // Shows annotations for take profit and stop loss prices
// if (not na(takeProfitPriceLong))
// label.new(x=bar_index, y=takeProfitPriceLong, text="TP Long", style=label.style_label_down, color=color.blue, textcolor=color.white)
// if (not na(stopLossPriceLong))
// label.new(x=bar_index, y=stopLossPriceLong, text="SL Long", style=label.style_label_up, color=color.red, textcolor=color.white)
// if (not na(takeProfitPriceShort))
// label.new(x=bar_index, y=takeProfitPriceShort, text="TP Short", style=label.style_label_up, color=color.blue, textcolor=color.white)
// if (not na(stopLossPriceShort))
// label.new(x=bar_index, y=stopLossPriceShort, text="SL Short", style=label.style_label_down, color=color.red, textcolor=color.white)