SMA 크로스오버 및 볼륨 필터링을 기반으로 한 적응형 동적 손절매 및 손절매 전략

개요
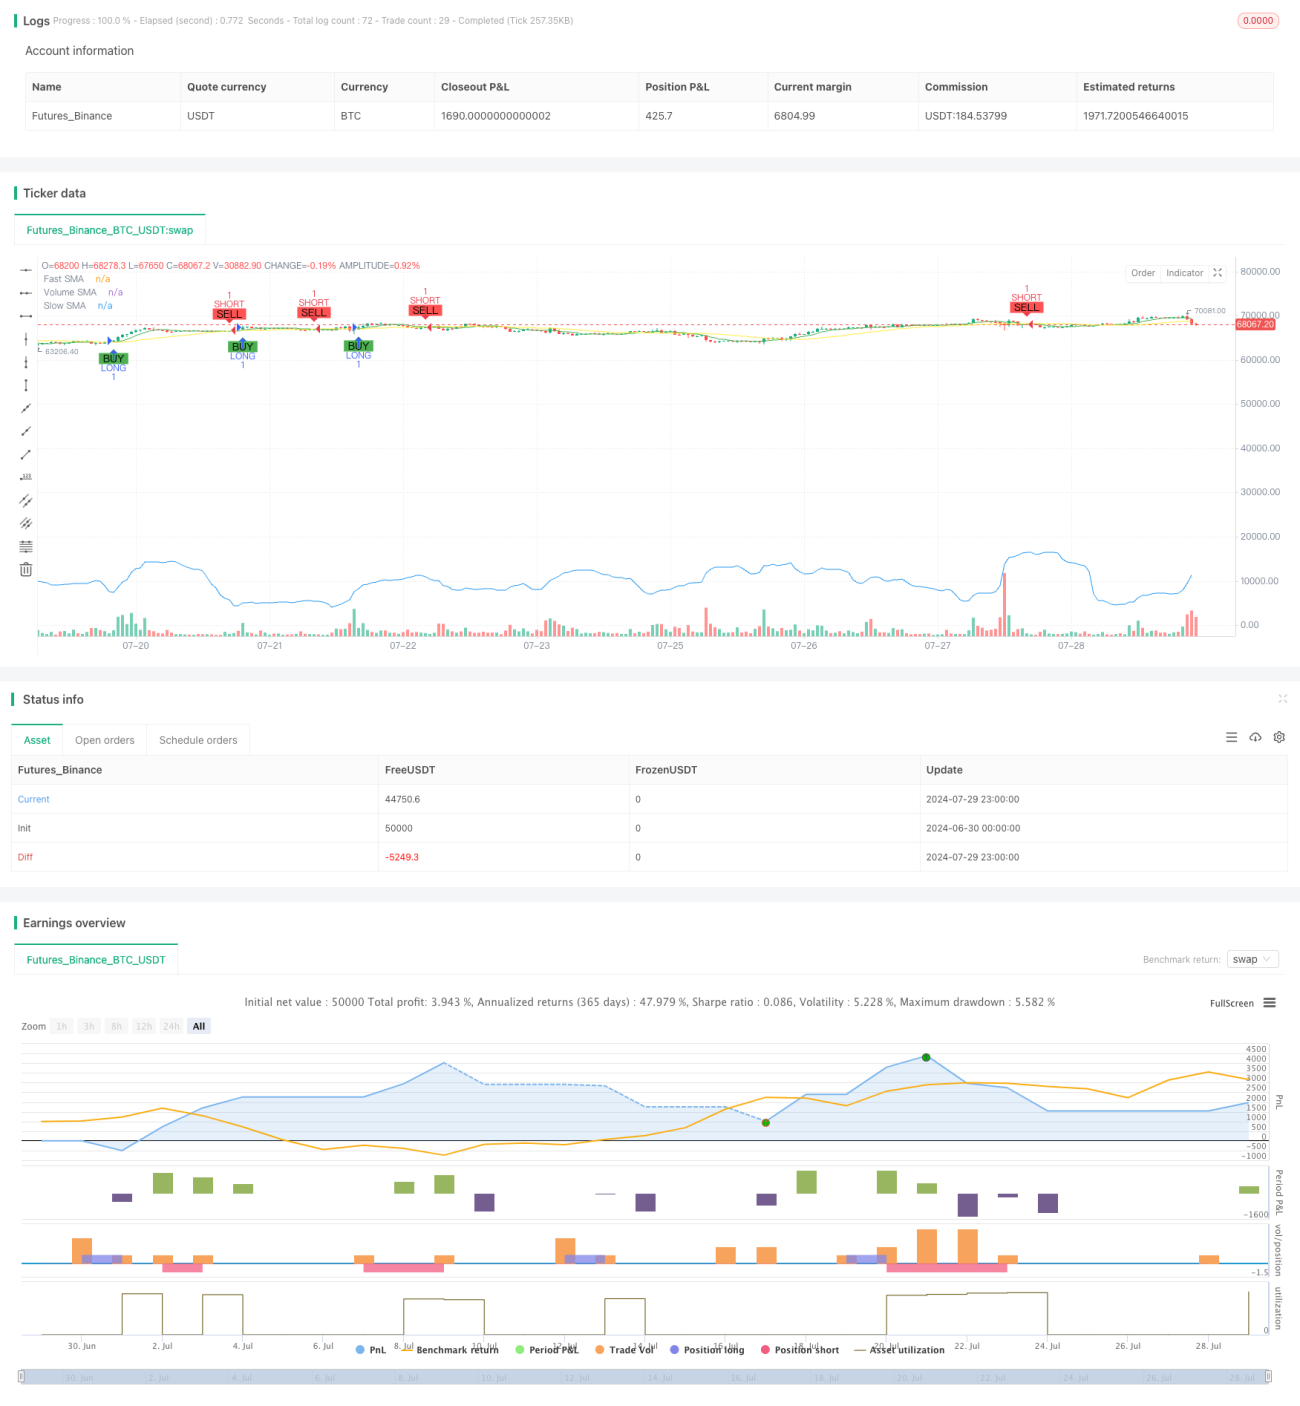
이 전략은 간단한 이동 평균 ((SMA) 의 교차와 교차량을 필터링하는 자동화 된 거래 시스템입니다. 그것은 빠른 및 느린 SMA의 교차를 사용하여 진입 신호를 생성하고, 트렌드 강도를 확인하기 위해 교류 지표를 결합합니다. 전략에는 또한 동적 인 손실 및 중지 장치와 시간 기반의 퇴출 조건이 포함되어 있으며, 이는 위험 관리를 최적화하고 수익성을 높이기 위해 고안되었습니다.
전략 원칙
이 전략의 핵심은 다음과 같은 몇 가지 핵심 요소에 기반합니다.
-
SMA 교차 신호:
- 두 개의 다른 주기의 간단한 이동 평균을 사용하여 (빠른 SMA와 느린 SMA)
- 빠른 SMA가 아래에서 느린 SMA를 통과하면 다중 신호가 생성됩니다.
- 빠른 SMA가 느린 SMA를 상단에서 통과하면 공백 신호가 발생합니다.
-
수송량 필터:
- 거래량을 계산하는 간단한 이동 평균
- 다중 신호는 현재 거래량이 거래량 SMA보다 높습니다.
- 공백 신호는 현재 거래량이 거래량 SMA보다 낮을 것을 요구합니다.
-
역동적 손해와 정지:
- 입시 가격에 따라 Stop Loss 및 Stop Loss 수준을 설정하는 비율
- 정지 및 정지 레벨은 입력 파라미터를 통해 조정할 수 있습니다
-
시간 기반 탈퇴:
- 최대 지분 시간을 설정 (K선으로 계산)
- 최대 보유 기간을 초과하는 자동 청산, 장기적으로 불리한 지위를 보유하는 것을 방지합니다.
-
탐사 중 설정:
- 사용자 정의 특정 재검토 시간 범위를 허용
- 전략이 지정된 역사 기간 동안만 실행되도록 보장합니다.
전략적 이점
-
트렌드 추적과 동력을 결합하는 방법:
SMA 교차와 거래량 필터링을 결합하여, 전략은 강한 추세 상황을 포착할 수 있으며, 약한 시장에서 자주 거래되는 것을 피할 수 있다. -
유연한 위험 관리:
다이내믹 스톱 및 스톱 메커니즘은 전략이 시장의 변동성에 따라 자동으로 위험 노출을 조정할 수 있도록 해 수익을 보호하고 잠재적 인 손실을 제한하는 데 도움이됩니다. -
과도한 포지션을 방지하기 위해:
최대 지분 시간 제한은 전략이 불리한 시장 조건에서 장기적으로 손실을 입는 것을 방지하고 자금을 효율적으로 사용하는 것을 촉진합니다. -
사용자 정의 가능:
여러 조정 가능한 파라미터 (SMA 주기, 스톱로스 <unk> 퍼센티지, 최대 포지션 기간 등) 는 전략이 다른 시장과 거래 스타일에 따라 최적화 될 수 있도록합니다. -
시각적인 지원:
전략은 SMA 선과 거래 신호를 차트에 그려서 전략의 성과를 직관적으로 이해하고 분석합니다.
전략적 위험
-
지연:
SMA 지표는 본질적으로 지연되어 있으며, 급격한 반전 시장에서 진입이 지연되거나 기회를 놓치게 될 수 있습니다. -
가짜 해킹 위험:
가로수지 시장에서 SMA 교차는 종종 가짜 브레이크 신호를 생성하여 과도한 거래와 거래 비용을 증가시킬 수 있습니다. -
매출액은
거래량 지표에 과도하게 의존하는 것은 특정 시장 조건에서, 특히 유동성이 낮거나 비정상적인 거래량 기간 동안 전략을 오해 할 수 있습니다. -
고정 비율 상쇄/정지:
고정된 비율의 스톱&로스트를 사용하는 것은 모든 시장 조건에 적합하지 않을 수 있습니다. 특히 급격한 변동성이 있는 기간에는 그렇습니다. -
시간적 탈퇴의 한계:
고정된 최대 지분 기간은 유리한 추세가 아직 끝나지 않은 상태에서 조기 청산으로 이어져 잠재적인 수익에 영향을 미칠 수 있다.
전략 최적화 방향
-
동적 변수 조정:
SMA 주기, 스톱로스 <unk> 퍼센티지, 최대 포지션 보유 시간 등을 동적으로 조정하여 다양한 시장 주기 및 변동성에 맞게 조정할 수 있습니다. -
추가 필터를 포함합니다:
다른 기술 지표 (RSI, MACD 등) 를 추가 필터링 조건으로 도입하여 거래 신호의 정확성을 향상시킵니다. -
"이런 일이 벌어질 수 있다.
동적으로 조정되는 거래량 하락 메커니즘을 개발하여 다른 시장 단계의 거래량 특성에 더 잘 적응합니다. -
탈퇴 메커니즘 개선:
시장 구조나 동력 지표에 기반한 스마트 탈퇴 메커니즘을 탐구하여 고정 시간 탈퇴를 대체하고 전략의 적응성을 향상시킵니다. -
변동성 조정:
시장의 변동성에 기반한 동적 스톱로스 및 스톱<unk> 레벨의 조정을 구현하여 위험을 더 잘 관리하고 수익을 포착합니다. -
다중 시간 프레임 분석:
여러 시간 프레임에 대한 데이터 분석을 통합하여 시장의 추세와 역전을 식별하는 전략의 능력을 향상시킵니다. -
기계학습 최적화:
기계 학습 알고리즘을 사용하여 전략 매개 변수를 동적으로 최적화하여 다양한 시장 환경에서 전략을 향상시킵니다.
요약하다
"SMA 교차와 거래량 필터링의 적응 동적 스톱 로드 전략"은 트렌드 추적, 거래량 분석 및 위험 관리를 결합한 통합 거래 시스템입니다. SMA 교차와 거래량 필터링을 활용하여 전략은 강력한 시장 추세를 포착하는 데에 목적이 있으며, 동적 스톱 로드 메커니즘과 시간 기반의 탈퇴 기능은 유연한 위험 관리를 제공합니다. 신호 지연과 고정된 파라미터에 대한 의존과 같은 고유 한 한 한계에도 불구하고, 전략은 여러 가지 최적화 방향을 제공합니다.
- 1