개요
트리플 인덱스 이동 평균 및 지원 저항 동적 거래 전략은 다중 기술 지표를 결합한 양적 거래 방법이다. 이 전략은 시장 추세를 판단하기 위해 3 개의 다른 기간의 지수 이동 평균 ((EMA) 을 사용하며 동적 지원 및 저항 수준을 결합하여 진입 시기를 최적화한다. 또한, 전략은 위험을 제어하고 이익을 잠금하기 위해 중지 및 중지 장치를 설정한다. 이 다차원 분석 방법은 거래의 정확성과 수익성을 향상시키기 위해 고안되었습니다.
전략 원칙
트리플 EMA 크로스:
- 단기 EMA (10주기) 와 중기 EMA (20주기) 의 교차는 거래 신호를 생성하기 위해 사용됩니다.
- 장기 EMA ((50주기) 는 전반적인 경향 방향을 확인하는 데 사용됩니다.
역동적인 지지 저항:
- 시스템 동적으로 20주기 동안의 최고 가격과 최저 가격을 실시간 저항과 지원 수준으로 식별한다.
입장 조건:
- 다중 조건: 중기 EMA를 넘어서서 단기 EMA를 상회하고, 장기 EMA와 지지율보다 높은 마감 가격.
- 공백 조건: 단기 EMA 아래에서 중간 EMA를 통과하고, 종결 가격은 장기 EMA와 저항 수준보다 낮다.
위험 관리:
- 입점 가격의 1%와 2%의 Stop Loss 및 Stop Stop 레벨을 설정합니다.
전략적 이점
다중 확인 메커니즘: 여러 기술 지표를 결합하여 거래 신호의 신뢰성을 향상시킵니다.
트렌드 추적: 장기 EMA를 사용하여 거래 방향이 주요 트렌드와 일치하는지 확인하십시오.
동적 지원 저항: 실시간으로 조정된 지원 저항 수준은 시장 구조에 대한 더 정확한 통찰력을 제공합니다.
위험 관리: 사전 설정된 스톱로스 및 스톱 스톱 메커니즘은 각 거래의 위험과 수익을 관리하는 데 도움이 됩니다.
유연성: 전략의 매개 변수는 다른 시장과 시간 프레임에 따라 조정할 수 있습니다.
전략적 위험
흔들림 시장의 성과: 가로판이나 흔들림 시장에서, 빈번한 거짓 신호가 발생할 수 있다.
지연성: 지연된 지표로서 EMA는 빠르게 변하는 시장에서 반응하지 않을 수 있다.
고정 퍼센트 스톱: 변동성이 높은 시장에서 고정 퍼센트 스톱은 너무 빡빡할 수 있다.
기술적인 지표에 지나치게 의존하는 것: 기본적 요소와 시장 감정의 영향을 무시하는 것
변수 민감성: 전략 성능은 EMA 주기와 스톱 스톱 비율의 선택에 매우 민감할 수 있다.
전략 최적화 방향
변동성 조정을 도입합니다.
- ATR (Average True Range) 를 사용하여 다양한 시장 변동에 대응하기 위해 중지 및 중지 수준을 동적으로 조정하는 것을 고려하십시오.
트렌드 강도 필터링:
- ADX (평균 방향 지수) 와 같은 지표가 도입되어 트렌드 강도가 충분할 때만 포지션을 개시하여 흔들리는 시장에서 가짜 신호를 줄인다.
지원 저항 인식 최적화:
- 더 복잡한 지지 저항 식별 알고리즘을 사용하는 것을 고려하십시오. 예를 들어, 분화 이론이나 수요 공급 영역에 기반한 방법.
트랜스포메이션 분석에 참여하세요:
- 거래량 지표, 예를 들어 OBV ((에너지 흐름) 또는 CMF ((자금 흐름 지표) 를 결합하여 가격 움직임의 유효성을 확인한다.
동적 변수 최적화를 구현하기:
- 최근 시장의 성과에 따라 EMA 주기와 다른 매개 변수를 자동으로 조정하는 적응 메커니즘을 개발하십시오.
다중 시간 프레임 분석을 고려하십시오.
- 거래 방향의 정확성을 높이기 위해 더 긴 시간 주기의 트렌드 확인을 도입하십시오.
시장 감정 지표 통합:
- 시장의 전환점을 더 잘 포착하기 위해 VIX와 같은 변동성 지수 또는 감정 지표를 추가하십시오.
요약하다
트리플 지수 이동 평균 및 지지부진 동적 거래 전략은 다중 지표의 조합을 통해 잠재적인 거래 기회를 식별하는 포괄적 인 기술 분석 거래 시스템입니다. 이 전략의 핵심 장점은 트렌드 추적, 동적 지지부진 저항 및 위험 관리를 포함한 다차원 시장 분석 방법에 있습니다. 그러나 모든 거래 전략과 마찬가지로 일부 고유한 위험과 한계에 직면합니다.
제안된 최적화 방향, 예를 들어 변동성 조정을 도입하고, 트렌드 강도 필터링을 증가시키고, 지지 저항의 식별을 최적화함으로써, 전략의 안정성과 적응성을 더욱 향상시킬 수 있습니다. 특히, 시장의 변동성과 다중 시간 프레임 분석을 고려하면, 다양한 시장 조건에서 전략의 성능을 크게 향상시킬 수 있습니다.
궁극적으로, 이 전략을 성공적으로 적용하려면 상인이 지속적으로 모니터링하고 변화하는 시장 환경에 적응하도록 조정해야합니다. 세심한 회귀와 전향적인 최적화를 통해 이 전략은 가치있는 시장 통찰력과 거래 기회를 제공하는 신뢰할 수있는 거래 도구가 될 잠재력을 가지고 있습니다.
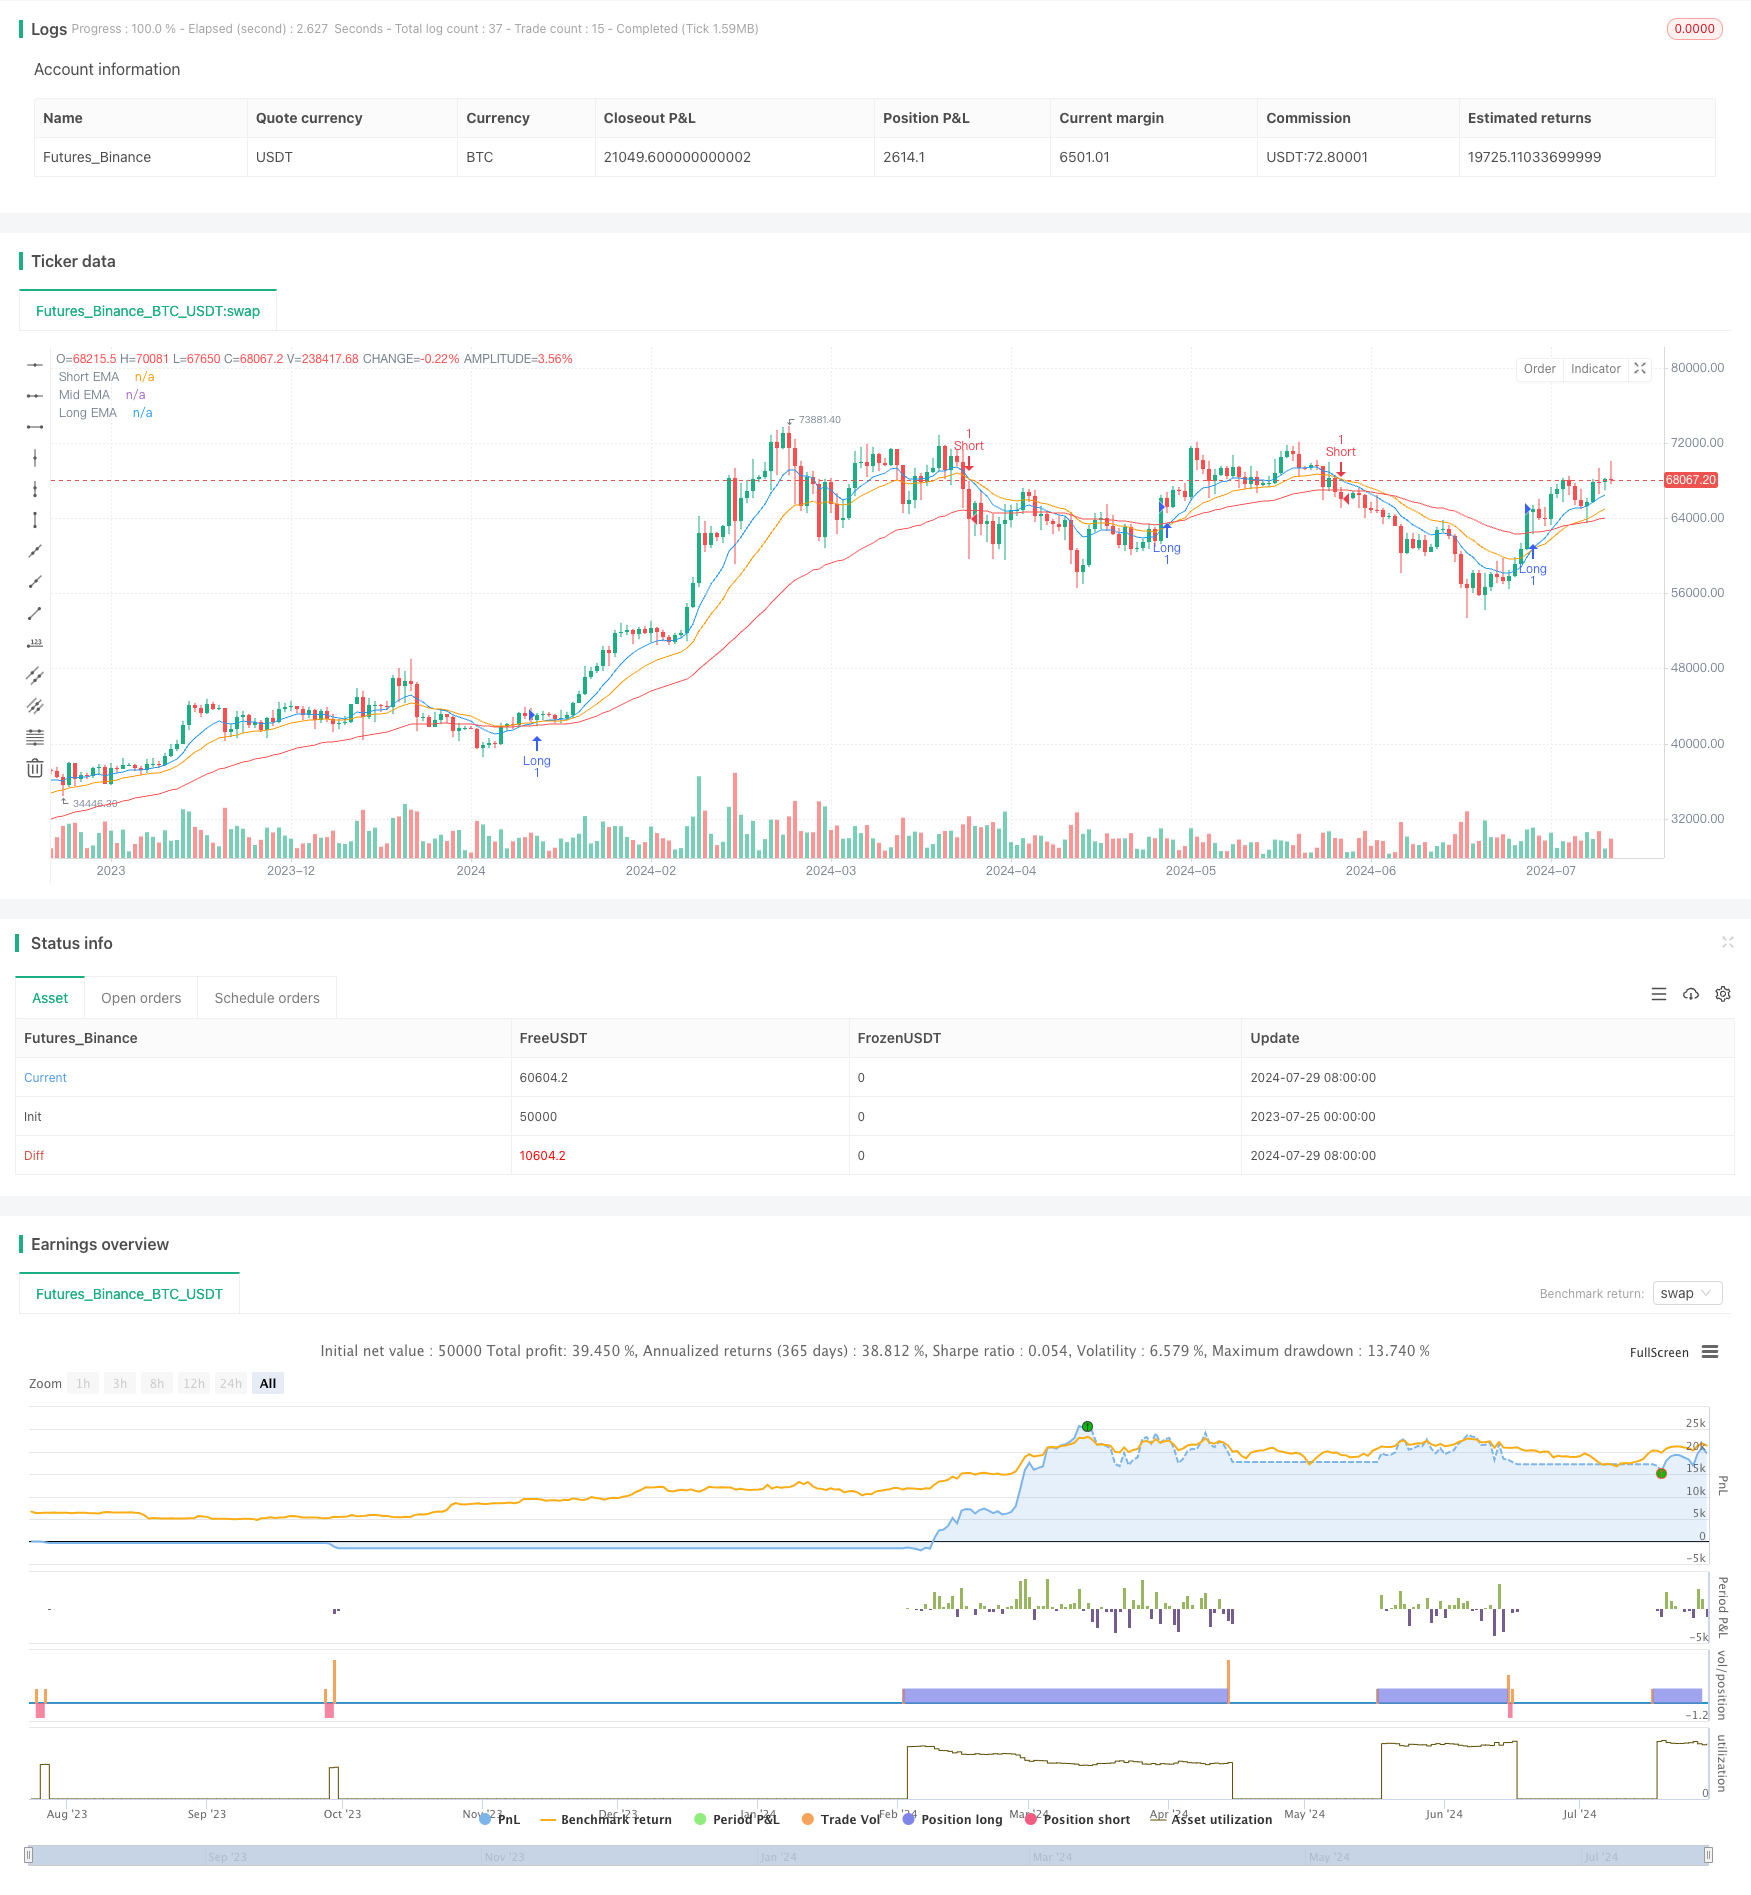
/*backtest
start: 2023-07-25 00:00:00
end: 2024-07-30 00:00:00
period: 1d
basePeriod: 1h
exchanges: [{"eid":"Futures_Binance","currency":"BTC_USDT"}]
*/

// This Pine Script™ code is subject to the terms of the Mozilla Public License 2.0 at https://mozilla.org/MPL/2.0/
// © AnubhavKumar

//@version=5
strategy("3 EMA Strategy with Support/Resistance", overlay=true)

// Input parameters
emaShortPeriod = input.int(10, title="Short EMA Period")
emaMidPeriod = input.int(20, title="Mid EMA Period")
emaLongPeriod = input.int(50, title="Long EMA Period")
stopLossPercent = input.float(1.0, title="Stop Loss (%)", minval=0.0, step=0.1)
targetProfitPercent = input.float(2.0, title="Target Profit (%)", minval=0.0, step=0.1)

// Calculate EMAs
emaShort = ta.ema(close, emaShortPeriod)
emaMid = ta.ema(close, emaMidPeriod)
emaLong = ta.ema(close, emaLongPeriod)

// Support and Resistance levels
var float supportLevel = na
var float resistanceLevel = na

if ta.lowest(close, 20) == close
    supportLevel := close

if ta.highest(close, 20) == close
    resistanceLevel := close

// Plot EMAs
plot(emaShort, color=color.blue, title="Short EMA")
plot(emaMid, color=color.orange, title="Mid EMA")
plot(emaLong, color=color.red, title="Long EMA")

// Plot dynamic support and resistance levels
// var line supportLine = na
// var line resistanceLine = na

// if not na(supportLevel)
    // line.delete(supportLine)
    // supportLine := line.new(x1=bar_index, y1=supportLevel, x2=bar_index[1], y2=supportLevel, color=color.green, width=2)

// if not na(resistanceLevel)
    // line.delete(resistanceLine)
    // resistanceLine := line.new(x1=bar_index, y1=resistanceLevel, x2=bar_index[1], y2=resistanceLevel, color=color.red, width=2)

// Define strategy logic
longCondition = ta.crossover(emaShort, emaMid) and close > emaLong and close > supportLevel
shortCondition = ta.crossunder(emaShort, emaMid) and close < emaLong and close < resistanceLevel

if (longCondition)
    strategy.entry("Long", strategy.long)
    stopLossPrice = close * (1 - stopLossPercent / 100)
    takeProfitPrice = close * (1 + targetProfitPercent / 100)
    strategy.exit("Take Profit/Stop Loss", "Long", stop=stopLossPrice, limit=takeProfitPrice)

if (shortCondition)
    strategy.entry("Short", strategy.short)
    stopLossPrice = close * (1 + stopLossPercent / 100)
    takeProfitPrice = close * (1 - targetProfitPercent / 100)
    strategy.exit("Take Profit/Stop Loss", "Short", stop=stopLossPrice, limit=takeProfitPrice)