
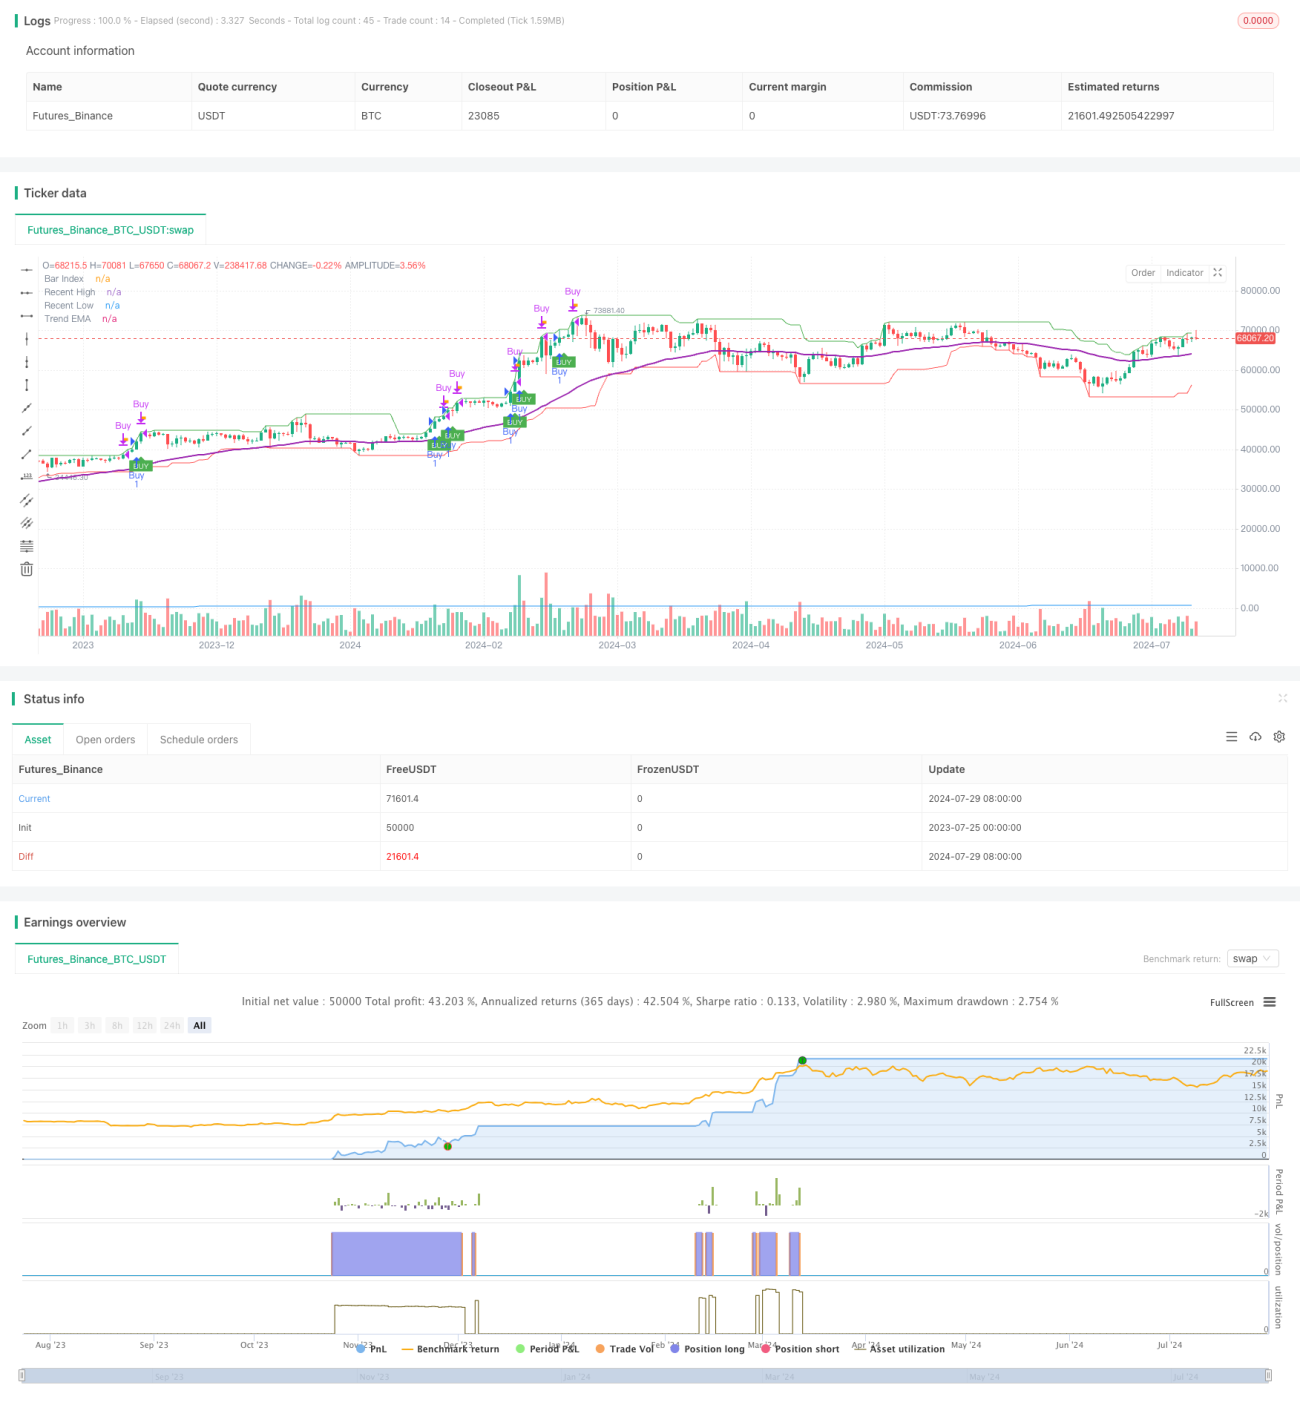
동적 트렌드 추적과 정밀 스톱 로드 전략은 가격 운동과 트렌드에 기반한 단기 거래 시스템이다. 이 전략은 지수 이동 평균 (EMA) 을 동적 트렌드 필터로 사용하여 가격 행동 패턴과 실제 파장 (ATR) 과 결합하여 잠재적인 거래 기회를 식별한다. 전략의 핵심은 정확한 입문 신호 생성 메커니즘과 동적으로 설정된 스톱 로드 (TP) 및 스톱 로드 (SL) 수준으로 수익 잠재력을 극대화하면서 위험을 효과적으로 제어하는 것이다.
트렌드 식별: 50주기 EMA를 동적인 트렌드 필터로 사용한다. 가격이 EMA 위에 있을 때만 더 많은 것을 고려하고, 반대로 공백을 고려한다. 이것은 거래 방향이 전체적인 경향과 일치하는 것을 보장한다.
진입 신호: 이 전략은 3개의 연속적인 가닥의 가격 행동을 분석하여 진입 시기를 결정한다. 구체적으로, 이 전략은 다음과 같은 패턴을 찾는다:
변동성 확인: 실제 파장 ((ATR) 의 변형을 사용하여 변동성이 충분할 때만 입장을 보장합니다. 이것은 시장이 너무 평온할 때 거래를 피하는 데 도움이됩니다.
동적 정지: 입문 후, 전략은 최근 고점 ((多做) 또는 낮은 점 ((空做) 에 따라 정지 목표를 설정한다. 이 방법은 강한 추세에서 더 많은 이익을 얻을 수 있다.
적응형 스톱: 스톱 포지션은 가장 가까운 낮은 지점 ((多做) 또는 높은 지점 ((空做) 에 설정되어, 시장 구조에 대한 동적 보호를 제공합니다.
실시간 실행: 전략은 시장의 조건을 매 가닥이 닫힐 때 평가하고, 최신 시장 데이터를 기반으로 의사 결정을 보장합니다.
트렌드 조화: EMA 필터로 거래 방향이 주요 트렌드와 일치하도록 보장하여 수익 가능성을 높인다.
정확한 입시: 엄격한 입시 조건 ((연속적인 가격 움직임과 변동성 확인) 은 가짜 신호를 줄이고 거래 품질을 향상시키는 데 도움이됩니다.
동적 위험 관리: 적응된 스톱 및 스톱 손실 메커니즘은 전략이 시장 구조에 따라 유연하게 조정될 수 있도록 하며, 자본을 보호하면서도 수익을 조기에 제한하지 않습니다.
변동성을 활용: ATR 변종을 통해 시장이 충분한 거래 기회를 제공 할 때만 입주를 보장하고, 낮은 변동성 기간에 과도한 거래를 피하십시오.
다중 시간 프레임 적응성: 전략의 매개 변수는 다양한 거래 품종과 시간 프레임에 따라 조정될 수 있으며, 광범위한 응용 가능성을 제공합니다.
시각적 피드백: 명확한 차트 표기 (매매 신호, 스톱 및 스톱 손실 트리거를 포함하여) 를 통해 거래자에게 직관적인 시장 통찰력을 제공합니다.
가짜 브레이크 위험: 위축 시장에서, 전략은 단기 변동이 트렌드 시작으로 오해되어 불필요한 거래로 이어질 수 있습니다.
슬라이드 포인트 영향: 빠르게 움직이는 시장에서 실제 실행 가격은 신호 생성 시의 가격과 현저하게 차이가 있을 수 있다.
과도한 거래: 높은 변동성 기간 동안, 전략은 과도한 신호를 생성하여 거래 비용을 증가시킬 수 있습니다.
트렌드 반전의 지연: EMA에 의존하는 것은 트렌드 반전의 초기 단계에서 기회를 놓치거나 불필요한 손실을 초래할 수 있다.
매개 변수 민감성: 전략 성능은 입력 매개 변수 (EMA 주기, ATR 배수 등) 에 매우 민감할 수 있으며, 신중한 최적화가 필요합니다.
이러한 위험을 줄이기 위해 다음과 같은 조치를 고려할 수 있습니다.
다중 시간 프레임 분석: 더 높은 시간 프레임의 트렌드 정보를 통합하면 진입 의사 결정의 정확성을 향상시킬 수 있습니다. 예를 들어, 일선 EMA를 추가 트렌드 필터로 추가 할 수 있습니다.
트렌드 식별을 개선하십시오. 더 정확한 트렌드 식별을 제공하기 위해 방향 이동 지수 (DMI) 또는 파라볼릭 SAR와 같은 더 복잡한 트렌드 지표를 사용하는 것을 고려하십시오.
최적화된 스톱 메커니즘: 스톱 추적을 구현하여 강력한 트렌드에서 더 오래 포지션을 유지할 수 있습니다. ATR의 배수를 사용하여 스톱 레벨을 동적으로 조정하는 것을 고려할 수 있습니다.
정교한 입시 조건: 거래량 확인 또는 다른 기술 지표 (RSI 또는 MACD와 같은) 를 추가하여 가격 움직임을 확인하고, 가짜 신호를 줄인다.
위험 관리 강화: 계좌 크기에 따라 포지션 크기를 조정하여 각 거래의 위험이 일치하도록하십시오. 목표 리스크 수익률을 사용하여 거래 결정을 최적화하는 것을 고려하십시오.
시장 환경 적응: 시장 환경 분류 시스템을 개발 (트렌드, 범위, 높은 / 낮은 변동성 등) 하고, 다른 시장 상태에 따라 전략 매개 변수를 조정한다.
머신러닝 통합: 머신러닝 알고리즘을 사용하여 파라미터를 최적화하거나 최적의 출전/출구 시간을 예측하여 전략의 적응성을 향상시킵니다.
이러한 최적화 방향은 전략의 안정성을 높이고, 가짜 신호를 줄이고, 다양한 시장 조건에서 그 효과를 유지하기 위한 것이다. 어떠한 최적화를 실행할 때, 철저한 역검사 및 전향 테스트를 실시하여 개선이 실제로 성능 향상을 가져온지 확인해야 한다.
동적 트렌드 추적과 정밀 스톱 스톱 전략은 트렌드 추적, 동적 거래 및 정밀한 위험 관리 기술을 결합한 정교하게 설계된 단기 거래 시스템입니다. 이 전략은 EMA 트렌드 필터, 엄격한 입시 조건 및 동적 스톱 스톱 메커니즘을 통해 시장의 단기 동적 기회를 포착하는 동시에 거래 자금을 과도한 위험으로부터 보호합니다.
전략의 주요 장점은 시장 구조에 대한 적응력과 정확한 위험 제어로 인해 다양한 시장 환경에서 안정적인 성능을 유지할 수 있습니다. 그러나 모든 거래 전략과 마찬가지로 가짜 돌파구 및 변수 민감성과 같은 몇 가지 고유한 위험에 직면합니다.
이 전략은 지속적으로 최적화 및 개선, 특히 다중 시간 프레임 분석, 고급 트렌드 식별 및 기계 학습 애플리케이션을 통해 성능과 적응력을 더욱 향상시킬 잠재력을 가지고 있습니다. 이 전략은 단기 거래에서 기회 포착과 위험 관리를 균형 잡으려고하는 거래자에게 견고한 기본 프레임 워크를 제공합니다.
마지막으로, 모든 시장 조건에 적합한 완벽한 전략은 없다는 것을 기억하는 것이 중요합니다. 성공적인 적용은 지속적인 모니터링, 테스트 및 조정, 그리고 개인의 위험 감수성과 거래 목표에 대한 깊은 이해가 필요합니다.
/*backtest
start: 2023-07-25 00:00:00
end: 2024-07-30 00:00:00
period: 1d
basePeriod: 1h
exchanges: [{"eid":"Futures_Binance","currency":"BTC_USDT"}]
*/
//@version=5
strategy("Scalp Slayer (i)", overlay=true)
// Input Parameters
filterNumber = input.float(1.5, "Filter Number", minval=1.0, maxval=10.0, tooltip="Higher = More aggressive Filter, Lower = Less aggressive")
emaTrendPeriod = input.int(50, "EMA Trend Period", minval=1, tooltip="Period for the EMA used for trend filtering")
lookbackPeriod = input.int(20, "Lookback Period for Highs/Lows", minval=1, tooltip="Period for determining recent highs/lows")
colorTP = input.color(title='Take Profit Color', defval=color.orange)
colorSL = input.color(title='Stop Loss Color', defval=color.red) // Added color for Stop Loss
// Inputs for visibility
showBuyLabels = input.bool(true, title="Show Buy Labels")
showSellLabels = input.bool(true, title="Show Sell Labels")
showStrategy = input.bool(true, title="Show Strategy", tooltip="Enable for strategy testing")
// Calculations
tr = high - low
ema = filterNumber * ta.ema(tr, 50)
trendEma = ta.ema(close, emaTrendPeriod) // Calculate the EMA for the trend filter
// Ensure calculations are based on historical data only
recentHigh = ta.highest(high, lookbackPeriod)
recentLow = ta.lowest(low, lookbackPeriod)
// Variables to track the entry prices for profit target and stop-loss
var float entryPriceLong = na
var float entryPriceShort = na
var float targetPriceLong = na
var float targetPriceShort = na
var float stopLossLong = na
var float stopLossShort = na
// Buy and Sell Conditions with Trend Filter
buy = close > trendEma and // Buy only if above the trend EMA
close[2] > open[2] and close[1] > open[1] and close > open and
(math.abs(close[2] - open[2]) > math.abs(close[1] - open[1])) and
(math.abs(close - open) > math.abs(close[1] - open[1])) and
close > close[1] and close[1] > close[2] and tr > ema
sell = close < trendEma and // Sell only if below the trend EMA
close[2] < open[2] and close[1] < open[1] and close < open and
(math.abs(close[2] - open[2]) > math.abs(close[1] - open[1])) and
(math.abs(close - open) > math.abs(close[1] - open[1])) and
close < close[1] and close[1] < close[2] and tr > ema
// Entry Rules
if (buy and barstate.isconfirmed) // Check for buy condition on candle close
if (showStrategy)
strategy.entry("Buy", strategy.long, comment="Buy at Close")
entryPriceLong := close // Track entry price for long position
targetPriceLong := recentHigh // Set take profit target to recent high
stopLossLong := recentLow // Set stop-loss to recent low
if (sell and barstate.isconfirmed) // Check for sell condition on candle close
if (showStrategy)
strategy.entry("Sell", strategy.short, comment="Sell at Close")
entryPriceShort := close // Track entry price for short position
targetPriceShort := recentLow // Set take profit target to recent low
stopLossShort := recentHigh // Set stop-loss to recent high
// Take Profit and Stop Loss Logic
signalBuyTPPrint = (not na(entryPriceLong) and close >= targetPriceLong)
signalSellTPPrint = (not na(entryPriceShort) and close <= targetPriceShort)
signalBuySLPrint = (not na(entryPriceLong) and close <= stopLossLong)
signalSellSLPrint = (not na(entryPriceShort) and close >= stopLossShort)
if (signalBuyTPPrint)
if (showStrategy)
strategy.close("Buy", comment="Close Buy at Profit Target")
entryPriceLong := na // Reset entry price for long position
targetPriceLong := na // Reset target price for long position
stopLossLong := na // Reset stop-loss for long position
if (signalSellTPPrint)
if (showStrategy)
strategy.close("Sell", comment="Close Sell at Profit Target")
entryPriceShort := na // Reset entry price for short position
targetPriceShort := na // Reset target price for short position
stopLossShort := na // Reset stop-loss for short position
if (signalBuySLPrint)
if (showStrategy)
strategy.close("Buy", comment="Close Buy at Stop Loss")
entryPriceLong := na // Reset entry price for long position
targetPriceLong := na // Reset target price for long position
stopLossLong := na // Reset stop-loss for long position
if (signalSellSLPrint)
if (showStrategy)
strategy.close("Sell", comment="Close Sell at Stop Loss")
entryPriceShort := na // Reset entry price for short position
targetPriceShort := na // Reset target price for short position
stopLossShort := na // Reset stop-loss for short position
// Plot Buy and Sell Labels with Visibility Conditions
plotshape(showBuyLabels and buy, "Buy", shape.labelup, location=location.belowbar, color=color.green, text="BUY", textcolor=color.white, size=size.tiny, offset=1)
plotshape(showSellLabels and sell, "Sell", shape.labeldown, location=location.abovebar, color=color.red, text="SELL", textcolor=color.white, size=size.tiny, offset=1)
// Plot Take Profit Flags
plotshape(showBuyLabels and signalBuyTPPrint, title="Take Profit (buys)", text="TP", style=shape.flag, location=location.abovebar, color=colorTP, textcolor=color.white, size=size.tiny)
plotshape(showSellLabels and signalSellTPPrint, title="Take Profit (sells)", text="TP", style=shape.flag, location=location.belowbar, color=colorTP, textcolor=color.white, size=size.tiny)
// Plot Stop Loss "X" Marker
plotshape(showBuyLabels and signalBuySLPrint, title="Stop Loss (buys)", text="X", style=shape.xcross, location=location.belowbar, color=colorSL, textcolor=color.white, size=size.tiny)
plotshape(showSellLabels and signalSellSLPrint, title="Stop Loss (sells)", text="X", style=shape.xcross, location=location.abovebar, color=colorSL, textcolor=color.white, size=size.tiny)
// Plot Trend EMA for reference
plot(showStrategy ? trendEma : na, title="Trend EMA", color=color.purple, linewidth=2)
// Plot recent high and low for debugging and validation
plot(showStrategy ? recentHigh : na, title="Recent High", color=color.green, linewidth=1)
plot(showStrategy ? recentLow : na, title="Recent Low", color=color.red, linewidth=1)
// Debugging: Plot bar index to verify real-time behavior
plot(showStrategy ? bar_index : na, title="Bar Index", color=color.blue)
// Debugging: Print the take profit and stop loss conditions
//label.new(bar_index, high, text="TP Buy: " + tostring(signalBuyTPPrint) + "\nSL Buy: " + tostring(signalBuySLPrint) + "\nTP Sell: " + tostring(signalSellTPPrint) + "\nSL Sell: " + tostring(signalSellSLPrint), color=color.blue, textcolor=color.white, size=size.small, style=label.style_label_down)