이중 이동 평균 모멘텀 거래 전략: 시간 최적화에 기반한 추세 추종 시스템

SMA MA
생성 날짜: 2024-07-31 14:50:26 마지막으로 수정됨: 2024-07-31 14:50:26
복사: 17 클릭수: 792
avatar of ChaoZhang ChaoZhang
1
집중하다
1617
수행원

이중 이동 평균 모멘텀 거래 전략: 시간 최적화에 기반한 추세 추종 시스템

개요

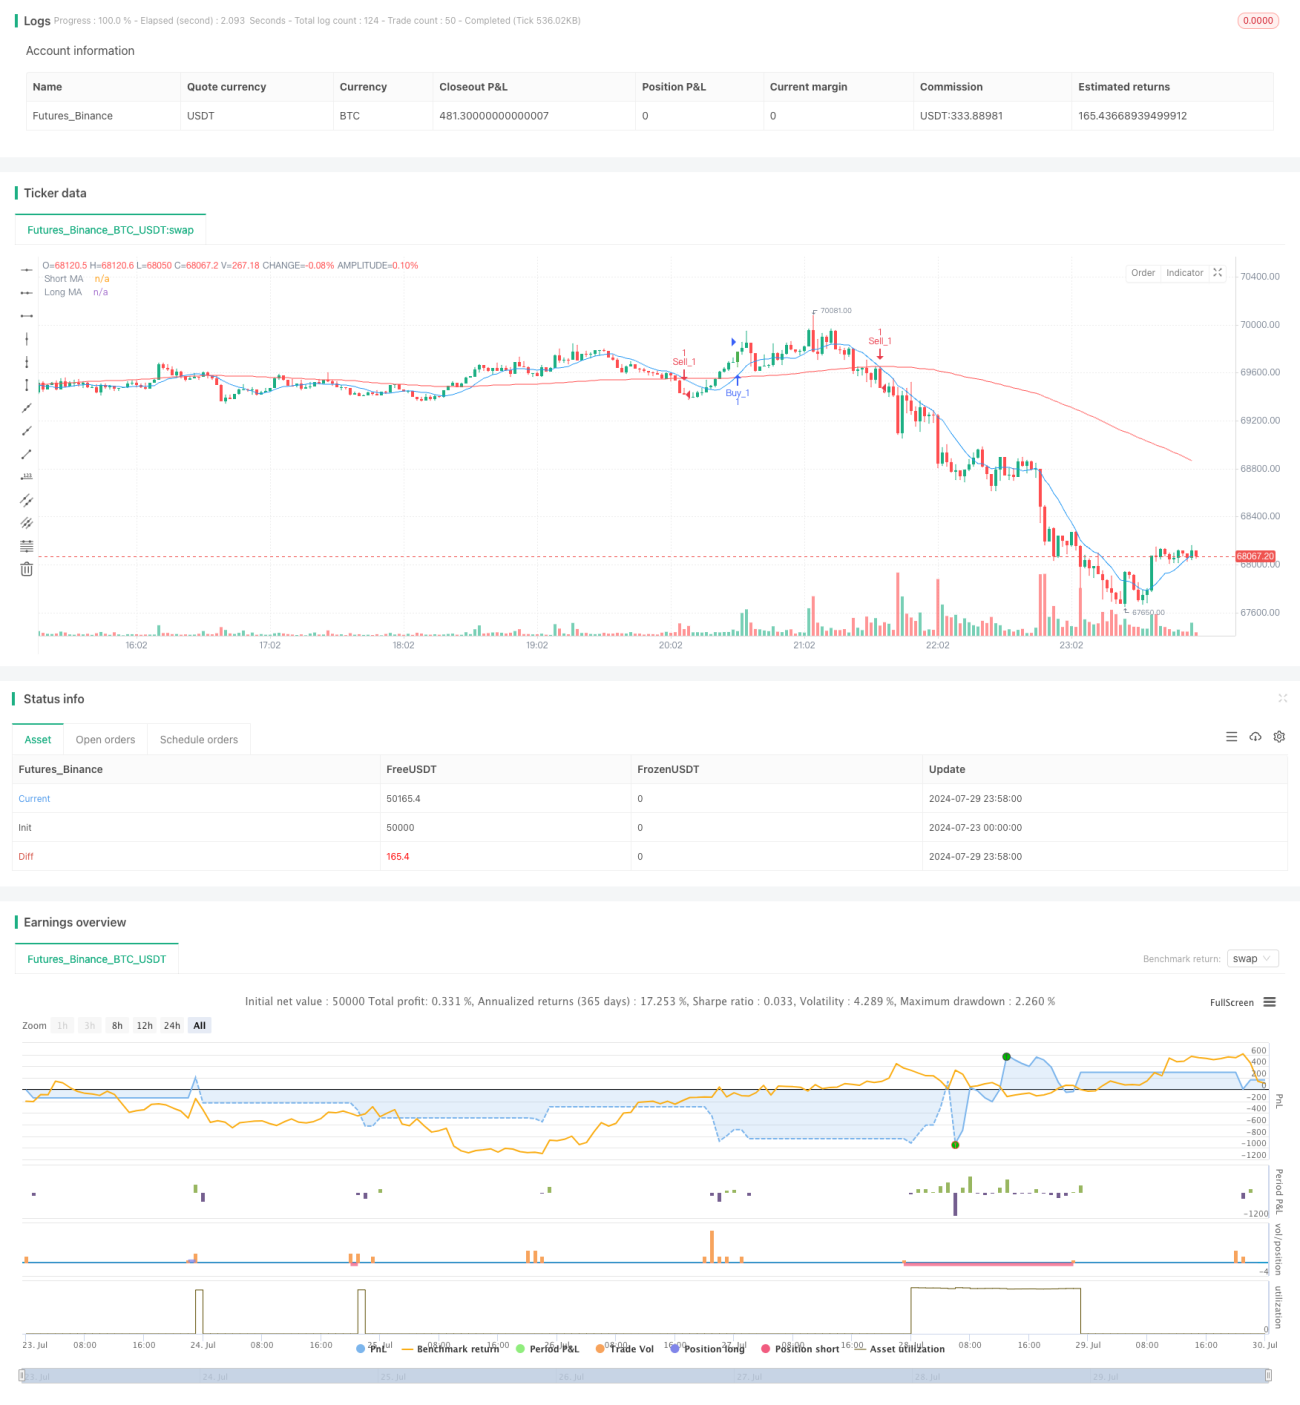
이 전략은 양평선 교차와 시간적 최적화를 기반으로 한 트렌드 추적 거래 시스템이다. 이 전략은 단기 및 장기 이동 평균의 교차를 사용하여 구매 및 판매 신호를 생성하며 특정 거래 시간 창과 결합하여 거래 실행을 최적화한다. 이 전략에는 위험과 수익을 관리하기 위해 여러 목표 가격 및 중지 수준이 포함되어 있습니다.

전략 원칙

이 전략의 핵심 원칙은 두 개의 서로 다른 기간의 이동 평균 ((MA) 을 사용하여 시장 추세를 식별하고 거래 신호를 생성하는 것입니다. 구체적으로:

  1. 단기 MA와 장기 MA: 전략은 두 개의 사용자 정의 이동 평균 주기를 사용하여 각각 단기 및 장기 시장 추세를 나타냅니다.

  2. 교차 신호: 단기 MA가 상향으로 장기 MA를 통과하면 구매 신호가 발생하고, 단기 MA가 상향으로 장기 MA를 통과하면 판매 신호가 발생한다.

  3. 시간 최적화: 전략은 거래 시간 창 개념을 도입하여 사용자 지정 UTC 시간 범위 내에서만 거래를 수행합니다. 이는 시장의 변동이 큰 또는 유동성이 낮은 시기를 피하는 데 도움이됩니다.

  4. 다중 목표 가격: 전략은 각 거래에 대해 두 개의 목표 가격 ((Target_1 및 Target_2) 을 설정하여 단계적으로 이익을 얻을 수 있습니다.

  5. 리스크 관리: 모든 거래에는 잠재적인 손실을 제한하기 위해 스톱로스 포인트가 설정됩니다.

  6. 시각화: 전략은 차트에서 구매 및 판매 신호를 표시하고 가격 목표 지점에 도달한 태그를 표시하여 거래자가 시장 동력을 직관적으로 이해할 수 있도록합니다.

전략적 이점

  1. 트렌드 추적: 이동 평균의 교차를 사용하여 전략은 시장의 추세를 효과적으로 포착하여 수익 기회를 향상시킬 수 있습니다.

  2. 시간 최적화: 거래 시간 창을 제한함으로써 전략은 시장이 가장 활발하고 가장 수익성이있는 시간에 집중하여 거래 효율성을 높일 수 있습니다.

  3. 리스크 관리: 다중 목표 가격과 스톱 손실 설정은 위험과 수익의 균형을 맞추고 자금의 안전을 보호합니다.

  4. 유연성: 사용자는 개인 취향과 시장 특성에 따라 MA 주기, 목표 가격 및 거래 시간 창을 조정할 수 있습니다.

  5. 시각적 도움말: 거래자는 차트에 매매 신호와 목표 가격의 도달 상황을 표시하여 전략의 성과를 더 직관적으로 이해할 수 있습니다.

  6. 양방향 거래: 전략은 상장과 하자를 동시에 지원하며, 다양한 시장 환경에서 기회를 찾을 수 있다.

전략적 위험

  1. 흔들림 시장의 위험: 가로 수평 흔들림 시장에서, 빈번한 MA 교차는 과도한 가짜 신호와 거래 비용을 초래할 수 있다.

  2. 슬라이드 포인트 위험: 빠른 시장에서 실제 거래 가격은 신호 생성 시의 가격과 현저하게 차이가 있을 수 있다.

  3. 과도한 역사적 데이터 의존: 이동 평균은 지연된 지표이며, 시장이 급격하게 변할 때 반응하지 않을 수 있다.

  4. 시간 창 제한: 엄격한 거래 시간 제한은 중요한 시장 기회를 놓치게 할 수 있습니다.

  5. 고정된 스톱 리스크: 고정된 점수를 사용하는 스톱은 높은 변동성이 있는 시기에 충분히 유연하지 않을 수 있다.

  6. 과도한 거래: 특정 시장 조건에서, 전략은 과도한 거래 신호를 생성하여 거래 비용을 증가시킬 수 있습니다.

전략 최적화 방향

  1. 동적 변수 조정: 시장의 변동성에 따라 MA 주기와 거래 변수를 조정하는 적응 장치를 도입하는 것을 고려하십시오.

  2. 변동율 필터를 추가: 거래 신호를 생성하기 전에 시장의 변동율을 먼저 평가하여 낮은 변동율 기간에 과도한 거래를 피하십시오.

  3. 개선된 손실 메커니즘: 다른 시장 조건에 적응하기 위해 ATR (평균 실제 범위) 에 기반한 동적 손실을 사용하는 것을 고려할 수 있습니다.

  4. RSI 또는 MACD와 같은 다른 기술 지표를 통합하여 트렌드 강도를 확인하고 신호 품질을 향상시킵니다.

  5. 회귀 최적화: 보다 광범위한 역사 데이터 회귀를 통해 최적의 변수 조합과 시간 창 설정을 찾아내는 것이다.

  6. 자금 관리 최적화: 계좌 규모와 시장의 변동성에 따라 거래 규모를 동적으로 조정하는 것과 같은 더 복잡한 포지션 관리 전략을 시행하십시오.

  7. 기본적 요소를 고려하십시오. 중요한 경제 데이터가 발표되기 전과 후에 전략적 행동을 조정하고 불확실성이 높은 기간 동안 거래를 피하십시오.

  8. 기계 학습 통합: 기계 학습 알고리즘을 사용하여 파라미터 선택 및 신호 생성 프로세스를 최적화하는 것을 탐구한다.

요약하다

이중 평행동량 거래 전략은 기술 분석과 시간 최적화를 결합한 트렌드 추적 시스템이다. 이동 평균의 교차와 정교하게 설계된 거래 시간 창을 활용하여 시장 추세를 포착하고 거래 실행을 최적화하기 위한 전략이다. 전략은 직관성과 유연성 등의 장점을 가지고 있지만 시장의 변동과 과도한 거래와 같은 위험에 직면해 있다. 이 전략은 역동적인 매개 변수 조정, 위험 관리 메커니즘의 개선 및 더 많은 기술적 지표를 통합하는 등의 지속적인 최적화와 개선으로 더 안정적이고 효율적인 거래 시스템이 될 가능성이 있다.

전략 소스 코드
/*backtest
start: 2024-07-23 00:00:00
end: 2024-07-30 00:00:00
period: 2m
basePeriod: 1m
exchanges: [{"eid":"Futures_Binance","currency":"BTC_USDT"}]
*/

//@version=5
strategy("Gold Trend Trader", shorttitle="Gold Trader", overlay=true)

// User-defined input for moving averages
shortMA = input.int(10, minval=1, title="Short MA Period")
longMA = input.int(100, minval=1, title="Long MA Period")
target_1 = input.int(100, minval=1, title="Target_1")
target_2 = input.int(150, minval=1, title="Target_2")

// User-defined input for the start and end times with default values
startTimeInput = input.int(12, title="Start Time for Session (UTC, in hours)", minval=0, maxval=23)
endTimeInput = input.int(17, title="End Time Session (UTC, in hours)", minval=0, maxval=23)
// Convert the input hours to minutes from midnight
startTime = startTimeInput * 60 
endTime = endTimeInput * 60  

// Function to convert the current exchange time to UTC time in minutes
toUTCTime(exchangeTime) =>
    exchangeTimeInMinutes = exchangeTime / 60000
    // Adjust for UTC time
    utcTime = exchangeTimeInMinutes % 1440
    utcTime

// Get the current time in UTC in minutes from midnight
utcTime = toUTCTime(time)

// Check if the current UTC time is within the allowed timeframe
isAllowedTime = (utcTime >= startTime and utcTime < endTime)

// Calculating moving averages
shortMAValue = ta.sma(close, shortMA)
longMAValue = ta.sma(close, longMA)

// Plotting the MAs
plot(shortMAValue, title="Short MA", color=color.blue)
plot(longMAValue, title="Long MA", color=color.red)

// Tracking buy and sell signals
var float buyEntryPrice_1 = na
var float buyEntryPrice_2 = na
var float sellEntryPrice_1 = na
var float sellEntryPrice_2 = na

// Logic for Buy and Sell signals
buySignal = ta.crossover(shortMAValue, longMAValue) and isAllowedTime
sellSignal = ta.crossunder(shortMAValue, longMAValue) and isAllowedTime

// Entry conditions for long and short trades
if (buySignal)
    strategy.entry("Buy_1", strategy.long)
    strategy.exit("TP_1", "Buy_1", limit=close + target_1, stop=close - 100)

    strategy.entry("Buy_2", strategy.long)
    strategy.exit("TP_2", "Buy_2", limit=close + target_2, stop=close - 1500)

if (sellSignal)
    strategy.entry("Sell_1", strategy.short)
    strategy.exit("TP_3", "Sell_1", limit=close - target_1, stop=close + 100)

    strategy.entry("Sell_2", strategy.short)
    strategy.exit("TP_4", "Sell_2", limit=close - target_2, stop=close + 150)

// Apply background color for entry candles
barcolor(buySignal ? color.green : sellSignal ? color.red : na)

// Creating buy and sell labels
if (buySignal)
    label.new(bar_index, low, text="BUY", style=label.style_label_up, color=color.green, textcolor=color.white, yloc=yloc.belowbar)

if (sellSignal)
    label.new(bar_index, high, text="SELL", style=label.style_label_down, color=color.red, textcolor=color.white, yloc=yloc.abovebar)

// Creating labels for 100-point movement
if (not na(buyEntryPrice_1) and close >= buyEntryPrice_1 + target_1)
    label.new(bar_index, high, text=str.tostring(target_1), style=label.style_label_down, color=color.green, textcolor=color.white, yloc=yloc.abovebar)
    buyEntryPrice_1 := na // Reset after label is created

if (not na(buyEntryPrice_2) and close >= buyEntryPrice_2 + target_2)
    label.new(bar_index, high, text=str.tostring(target_2), style=label.style_label_down, color=color.green, textcolor=color.white, yloc=yloc.abovebar)
    buyEntryPrice_2 := na // Reset after label is created

if (not na(sellEntryPrice_1) and close <= sellEntryPrice_1 - target_1)
    label.new(bar_index, low, text=str.tostring(target_1), style=label.style_label_up, color=color.red, textcolor=color.white, yloc=yloc.belowbar)
    sellEntryPrice_1 := na // Reset after label is created

if (not na(sellEntryPrice_2) and close <= sellEntryPrice_2 - target_2)
    label.new(bar_index, low, text=str.tostring(target_2), style=label.style_label_up, color=color.red, textcolor=color.white, yloc=yloc.belowbar)
    sellEntryPrice_2 := na // Reset after label is created