RSI 다중 범위 거래 전략

RSI TP SL
생성 날짜: 2024-09-26 15:27:00 마지막으로 수정됨: 2024-09-26 15:27:00
복사: 1 클릭수: 433
avatar of ChaoZhang ChaoZhang
1
집중하다
1617
수행원

RSI 다중 범위 거래 전략

개요

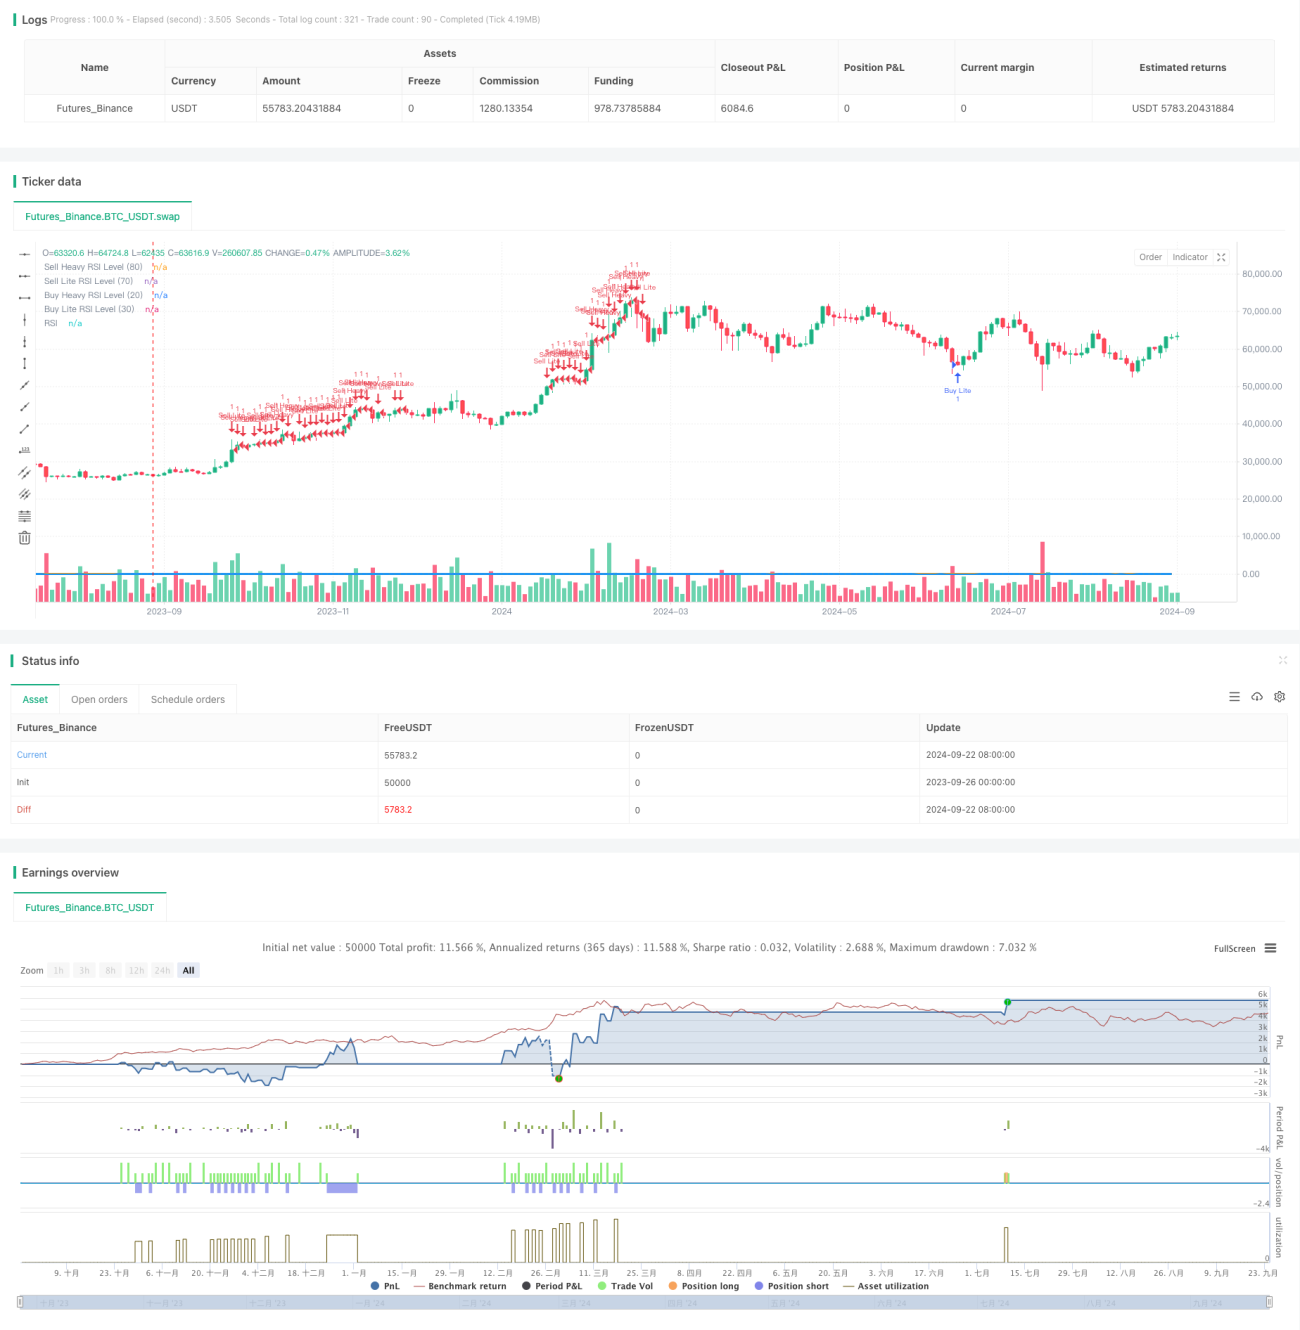
RSI 다중 간 거래 전략은 상대적으로 약한 지표 (RSI) 를 기반으로 한 자동화 된 거래 시스템으로, 5 분 차트를 위해 고안되었습니다. 이 전략은 여러 RSI 간을 분할하여 서로 다른 강도의 구매 및 판매 신호를 유발하며, 리스크를 관리하기 위해 중지 및 중지 장치를 결합합니다. 이 방법은 거래자가 시장의 과매매 및 과매매 정도에 따라 위치를 유연하게 조정할 수 있도록 해 주며, 변동 시장에서 단기 가격 변화를 잡을 수 있습니다.

전략 원칙

이 전략의 핵심은 RSI 지표를 사용하여 다양한 수준에서 거래 신호를 유발하는 것입니다.

  1. 구매 신호:

    • RSI <20: ‘중력 구매’를 촉발한다
    • 20~30의 RSI: ‘조심한 구매’를 촉발한다
  2. 신호를 팔아:

    • RSI >80: ‘중력 판매’를 촉발한다
    • 70~80의 RSI: ‘조금 팔아치운다’

각 거래에는 수익을 보호하고 잠재적 인 손실을 제한하기 위해 고정된 스톱 및 스톱 손실 수준이 있습니다. 전략에는 RSI가 중요한 수준에 도달했을 때 거래자에게 알리는 경고 기능도 포함되어 있습니다.

전략적 이점

  1. 다단계 진입: “중도”와 “약도”의 거래 신호를 구분하여, 전략은 시장의 과매매 / 과매매 정도에 따라 강하고 약한 위치 크기를 조정할 수 있습니다.

  2. 위험 관리: 내장된 스톱 및 스톱 손실 메커니즘은 단일 거래로 과도한 손실을 방지하기 위해 위험 통제를 자동화하는 데 도움이됩니다.

  3. 높이는 사용자 정의 가능합니다. 거래자는 개인 위험 선호와 시장 조건에 따라 RSI 수준, 스톱 스톱 손실 포인트와 같은 파라미터를 조정할 수 있습니다.

  4. 실시간 경보: 이 전략은 여러 경보 트리거를 설정하여 거래자가 시장의 움직임을 적시에 관찰할 수 있도록 도와줍니다. 자동 거래가 실제로 실행되지 않더라도 가치있는 시장 통찰력을 얻을 수 있습니다.

  5. 적응력: 이 전략은 다양한 금융 도구에 적용되며, 특히 변동성이 높은 시장에 적합하다.

전략적 위험

  1. 가짜 브레이크 위험: 불안정한 시장에서 RSI는 종종 설정된 하락점을 넘어서서 과도한 거래와 잠재적인 손실을 초래할 수 있습니다.

  2. 트렌드 시장의 성과: 강한 트렌드에서, 전략은 너무 일찍 평점 또는 큰 시장을 놓칠 수 있습니다. RSI는 장기간 과매매 또는 과매매 영역에있을 수 있기 때문입니다.

  3. 변수 감수성: 전략의 성능은 RSI 변수와 출입값의 설정에 크게 의존하며, 부적절한 변수는 부실한 성능을 초래할 수 있다.

  4. 슬라이드 포인트 위험: 빠른 시장에서 실제 거래 가격은 예상과 크게 차이가 날 수 있으며, 스톱 스톱의 유효성에 영향을 미칩니다.

  5. 과도한 거래: 거래 신호의 빈도는 거래 비용을 과도하게 높여 잠재적인 수익을 훼손할 수 있습니다.

전략 최적화 방향

  1. 트렌드 필터를 도입: 이동 평균 또는 다른 트렌드 지표와 결합하여 강한 트렌드에서 역전 거래하는 것을 피하십시오.

  2. 동적 중지 손실: 시장의 변동성에 따라 자동으로 중지 중지 손실 수준을 조정하여 다른 시장 환경에 맞게 조정합니다.

  3. 시간 필터: 거래 시간 창 제한을 늘리고, 유동성이 낮은 시간이나 중요한 뉴스 발표 시간을 피하십시오.

  4. 양적 분석 최적화: 피드백 데이터를 사용하여 몬테카로 시뮬레이션을 수행하여 최적의 변수 조합을 찾습니다.

  5. 다른 기술 지표와 결합: MACD 또는 브린 띠와 같은 거래 신호의 확인 메커니즘을 추가.

  6. 포지션 관리 최적화: 계정 잔액과 시장의 변동성에 기반한 동적 포지션 관리를 구현한다.

요약하다

RSI 다중 간 거래 전략은 시장 동력에 기반한 체계화된 거래 방법을 거래자에게 제공합니다. 이 전략은 RSI 레벨을 세분화하고 다중 수준의 거래 신호를 도입하여 단기 시장 변동을 포착하는 동시에 스톱 스톱 손실 메커니즘을 통해 위험을 관리하는 것을 목표로합니다. 이 전략은 고도의 사용자 정의와 잠재적인 수익성을 가지고 있지만, 거래자는 변수 최적화와 시장 적응성의 도전에 주의를 기울여야합니다.

전략 소스 코드
/*backtest
start: 2023-09-26 00:00:00
end: 2024-09-24 08:00:00
period: 2d
basePeriod: 2d
exchanges: [{"eid":"Futures_Binance","currency":"BTC_USDT"}]
*/

//@version=5
strategy("M5 Trading Rule", overlay=true)

// Copyright © 2024 TRADINGWITHKAY. All rights reserved.
// Unauthorized use, distribution, and modification of this code are strictly prohibited.

// Input parameters
rsiLength = input(14, title="RSI Length")
rsiOverboughtHeavy = input(80, title="RSI Sell Heavy Level")
rsiOverboughtLite = input(70, title="RSI Sell Lite Level")
rsiOversoldHeavy = input(20, title="RSI Buy Heavy Level")
rsiOversoldLite = input(30, title="RSI Buy Lite Level")
takeProfitPips = input(50, title="Take Profit (Pips)")
stopLossPips = input(50, title="Stop Loss (Pips)")
pipValue = syminfo.mintick * 10 // Assuming 1 pip = 0.0001 for Forex

// Calculate RSI
rsi = ta.rsi(close, rsiLength)

// Convert pips to price distance
takeProfitPrice = takeProfitPips * pipValue
stopLossPrice = stopLossPips * pipValue

// Conditions for entries
buyHeavyCondition = rsi < rsiOversoldHeavy
buyLiteCondition = rsi < rsiOversoldLite and not buyHeavyCondition
sellHeavyCondition = rsi > rsiOverboughtHeavy
sellLiteCondition = rsi > rsiOverboughtLite and not sellHeavyCondition

// Plot the RSI levels for overbought and oversold zones
plot(rsiOverboughtHeavy, title="Sell Heavy RSI Level (80)", color=color.red, linewidth=2, style=plot.style_line)
plot(rsiOverboughtLite, title="Sell Lite RSI Level (70)", color=color.orange, linewidth=2, style=plot.style_line)
plot(rsiOversoldHeavy, title="Buy Heavy RSI Level (20)", color=color.green, linewidth=2, style=plot.style_line)
plot(rsiOversoldLite, title="Buy Lite RSI Level (30)", color=color.blue, linewidth=2, style=plot.style_line)

// Execute Buy Heavy
if (buyHeavyCondition)
    strategy.entry("Buy Heavy", strategy.long)
    // Separate Take Profit and Stop Loss
    strategy.exit("Take Profit", "Buy Heavy", limit=close + takeProfitPrice)
    strategy.exit("Stop Loss", "Buy Heavy", stop=close - stopLossPrice)
    alert("RSI is below 20! Buy Heavy Condition Triggered!", alert.freq_once_per_bar)

// Execute Buy Lite
if (buyLiteCondition)
    strategy.entry("Buy Lite", strategy.long)
    // Separate Take Profit and Stop Loss
    strategy.exit("Take Profit", "Buy Lite", limit=close + takeProfitPrice)
    strategy.exit("Stop Loss", "Buy Lite", stop=close - stopLossPrice)
    alert("RSI is below 30! Buy Lite Condition Triggered!", alert.freq_once_per_bar)

// Execute Sell Heavy
if (sellHeavyCondition)
    strategy.entry("Sell Heavy", strategy.short)
    // Separate Take Profit and Stop Loss
    strategy.exit("Take Profit", "Sell Heavy", limit=close - takeProfitPrice)
    strategy.exit("Stop Loss", "Sell Heavy", stop=close + stopLossPrice)
    alert("RSI is above 80! Sell Heavy Condition Triggered!", alert.freq_once_per_bar)

// Execute Sell Lite
if (sellLiteCondition)
    strategy.entry("Sell Lite", strategy.short)
    // Separate Take Profit and Stop Loss
    strategy.exit("Take Profit", "Sell Lite", limit=close - takeProfitPrice)
    strategy.exit("Stop Loss", "Sell Lite", stop=close + stopLossPrice)
    alert("RSI is above 70! Sell Lite Condition Triggered!", alert.freq_once_per_bar)

// Plot RSI on a separate chart for easier visibility
plot(rsi, title="RSI", color=color.blue, linewidth=2)

// Alert when price hits the high or low RSI levels
if (rsi <= rsiOversoldHeavy)
    alert("Price has reached the Buy Heavy RSI Level (20)!", alert.freq_once_per_bar)

if (rsi <= rsiOversoldLite and rsi > rsiOversoldHeavy)
    alert("Price has reached the Buy Lite RSI Level (30)!", alert.freq_once_per_bar)

if (rsi >= rsiOverboughtHeavy)
    alert("Price has reached the Sell Heavy RSI Level (80)!", alert.freq_once_per_bar)

if (rsi >= rsiOverboughtLite and rsi < rsiOverboughtHeavy)
    alert("Price has reached the Sell Lite RSI Level (70)!", alert.freq_once_per_bar)