가우시안 크로스오버 EMA 추세 미끄러짐 추종 전략

EMA RSI MACD ATR ADX
생성 날짜: 2024-09-26 15:34:01 마지막으로 수정됨: 2024-09-26 15:34:01
복사: 1 클릭수: 497
avatar of ChaoZhang ChaoZhang
1
집중하다
1617
수행원

가우시안 크로스오버 EMA 추세 미끄러짐 추종 전략

개요

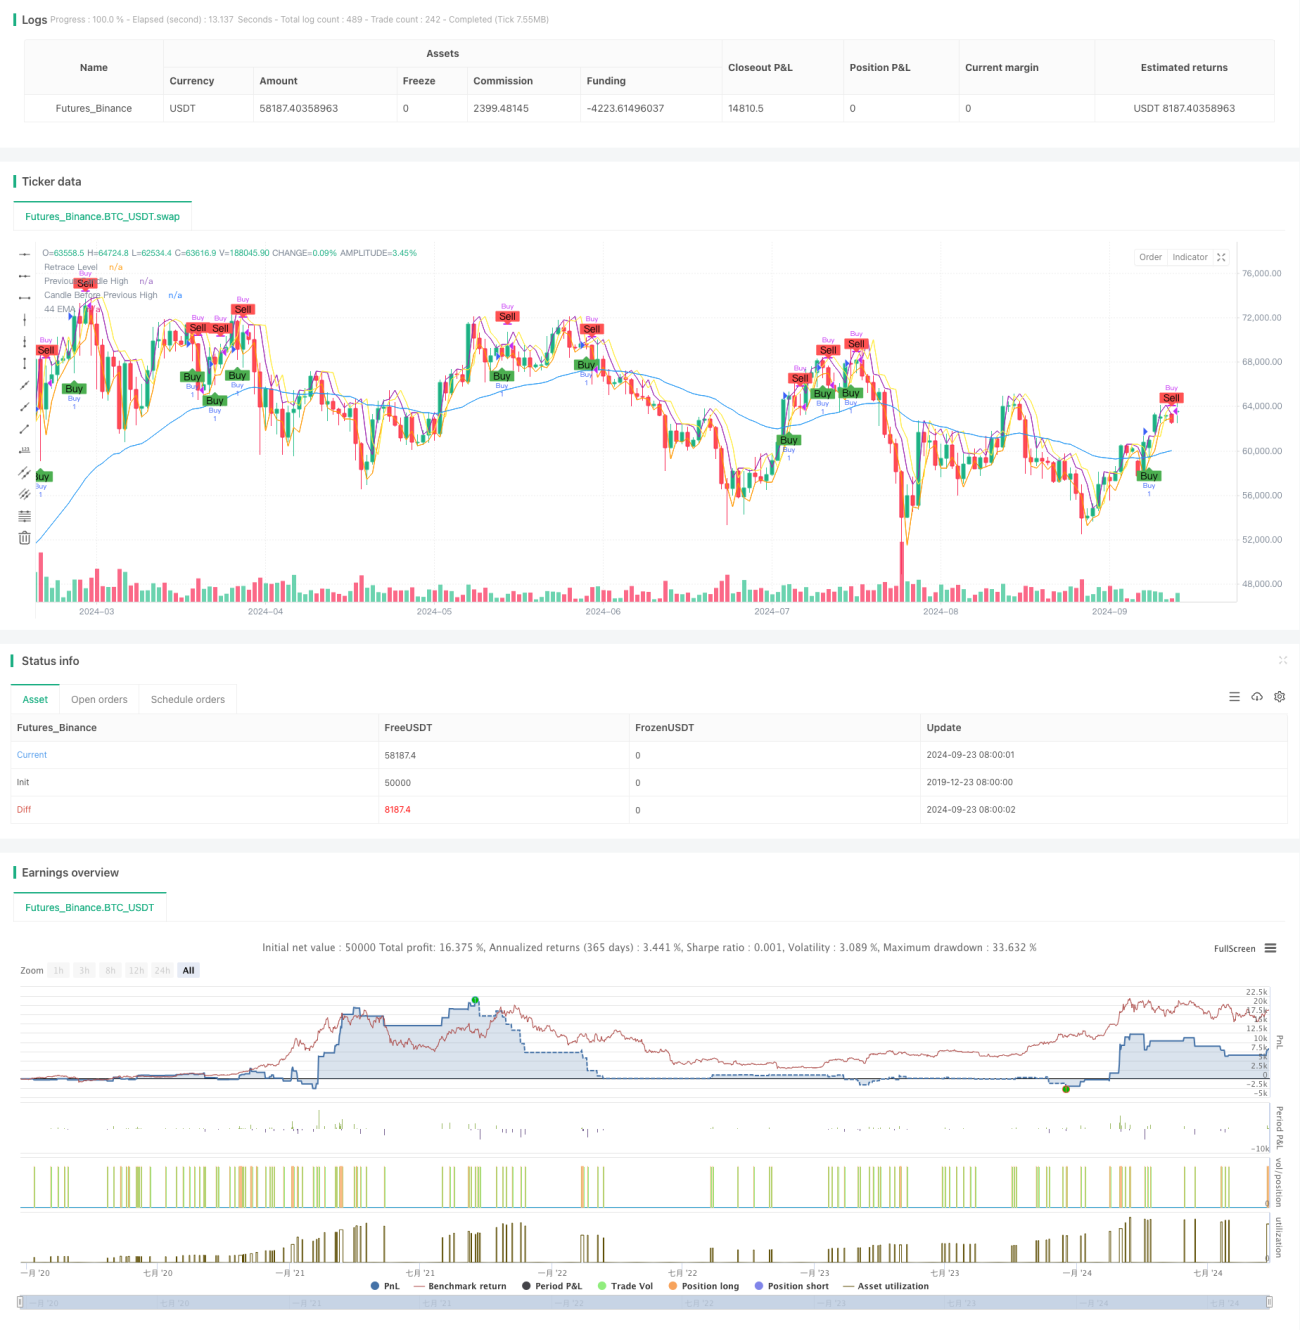
이것은 44주기 지수 이동 평균 (EMA) 을 기반으로 한 트렌드 추적 전략이다. 이 전략은 주로 상승 추세에서 구매 기회를 찾고, EMA 경사, 도표 형태 및 가격 회수와 같은 여러 조건을 분석하여 출입 시간을 결정한다. 전략은 2분 및 5분과 같은 짧은 시간 주기에도 적용되며, 단기 가격 변동 중 거래 기회를 잡기 위해 설계되었다.

전략 원칙

  1. 44주기 EMA와 그 기울기를 계산하여 트렌드가 충분히 기울어졌는지 판단하십시오.
  2. 첫 번째 의 형태를 분석하여, 태양선이고 EMA보다 높은 마감 가격을 요구한다.
  3. 현재 이 이전 개체의 50% 위치로 후퇴하는지 관찰한다.
  4. 이전 의 매각 가격이 이전 의 최고 가격보다 높게 확인하여 상승 추세가 지속되는지 확인한다.
  5. 모든 조건이 충족되면, 현재 의 철수 위치에서 포지션을 열고 더 많이 한다.
  6. 출구 조건은: 앞의 은 음선 또는 현재 하락점이 앞의 하락점을 넘어서는 것이다.

전략적 이점

  1. 다중 필터링: EMA, 그래프 형태 및 가격 회수와 같은 여러 지표를 결합하여 가짜 신호를 효과적으로 감소시킵니다.
  2. 트렌드 따라가기: EMA 경사 판단을 통해 명확한 상승 추세에서 거래하는 것을 보장하고, 승률을 높인다.
  3. 회수 입구: 가격 회수를 입구 지점으로 사용하여 구매 가격을 최적화하여 잠재적으로 수익 공간을 향상시킵니다.
  4. 유연성: 짧은 라인 및 일일 거래자를 위한 다양한 시간 주기 적용이 가능합니다.
  5. 위험 통제: 명확한 스톱 로즈 조건이 있어 거래마다 위험을 통제하는 데 도움이 됩니다.

전략적 위험

  1. 지연성: 지연된 지표로서, 급격한 변동 상황에서는 반응하지 않을 수 있다.
  2. 가짜 돌파: 가로 디스크 정리 구역에서 빈번한 가짜 돌파 신호가 발생할 수 있다.
  3. 과도한 거래: 높은 변동성 시장에서 과도한 거래를 유발하여 거래 비용을 증가시킬 수 있습니다.
  4. 트렌드 역전: 급격한 트렌드 역전으로 인해 큰 손실이 발생할 수 있습니다.
  5. 매개 변수 민감성: 정책 효과는 EMA 주기 등 매개 변수 설정에 민감하다.

전략 최적화 방향

  1. RSI 또는 MACD와 같은 추가 필터를 도입하여 트렌드 강도 및 방향을 추가로 확인합니다.
  2. 다이내믹 스톱: ATR 지표를 사용하여 다이내믹 스톱을 설정하여 시장의 변동에 더 잘 적응합니다.
  3. 통행량 분석: 통행량 지표를 결합하여 입구 신호의 신뢰성을 높인다.
  4. 최적 EMA 주기: 다른 EMA 주기들을 재검토하여 최적의 변수 조합을 찾는다.
  5. 트렌드 강도 지표: ADX와 같이, 강한 트렌드에서만 출전을 보장한다.
  6. 더 나은 출전 메커니즘: 트레일링 스톱 (trailing stop) 과 같은 더 정교한 승부차기 전략을 설계했다.

요약하다

고스 크로스 EMA 트렌드 슬라이드 트래킹 전략은 다중 기술 지표를 결합한 트렌드 추적 시스템이다. 이 전략은 EMA, 도표 형태 분석 및 가격 회수와 같은 다차원 판단을 통해 상승 추세를 식별하고 진입 시기를 최적화하는 데 좋은 잠재력을 보여준다. 그러나 사용자는 과도한 거래 위험을 통제하고 다양한 시장 환경에 대한 매개 변수를 최적화하는 데 주의를 기울여야 한다.

전략 소스 코드
/*backtest
start: 2019-12-23 08:00:00
end: 2024-09-24 08:00:00
period: 1d
basePeriod: 1d
exchanges: [{"eid":"Futures_Binance","currency":"BTC_USDT"}]
*/

//@version=5
strategy("Custom Strategy with EMA and Candle Conditions", overlay=true)

// Define parameters
ema_length = 44

// Calculate EMA
ema_44 = ta.ema(close, ema_length)

// Calculate the slope of the EMA
ema_slope = ta.ema(close, ema_length) - ta.ema(close[9], ema_length)

// Define a threshold for considering the EMA flat
flat_threshold = 0.5

// Check if the EMA is flat or inclined
ema_is_inclined = math.abs(ema_slope) > flat_threshold

// Define the previous candle details
prev_candle_high = high[1]
prev_candle_low = low[1]
prev_candle_close = close[1]
prev_candle_open = open[1]

// Candle before the previous candle (for high comparison)
candle_before_prev_high = high[2]

// Current candle details
current_candle_high = high
current_candle_low = low
current_candle_close = close
current_candle_open = open

// Previous to previous candle details
prev_prev_candle_low = low[2]

// Previous candle body and wick length
prev_candle_body = math.abs(prev_candle_close - prev_candle_open)
prev_candle_wick_length = math.max(prev_candle_high - prev_candle_close, prev_candle_close - prev_candle_low)

// Calculate retrace level for the current candle
retrace_level = prev_candle_close - (prev_candle_close - prev_candle_low) * 0.5

// Check if the previous candle's wick is smaller than its body
prev_candle_condition = prev_candle_wick_length < prev_candle_body

// Check if the previous candle is a green (bullish) candle and if the previous candle's close is above EMA
prev_candle_green = prev_candle_close > prev_candle_open
prev_candle_red = prev_candle_close < prev_candle_open
prev_candle_above_ema = prev_candle_close > ema_44

// Entry condition: The current candle has retraced to 50% of the previous candle's range, previous candle was green and above EMA, and the high of the current candle is above the retrace level, and EMA is inclined
entry_condition = prev_candle_close > candle_before_prev_high and
                   prev_candle_green and
                   prev_candle_above_ema and
                   current_candle_low <= retrace_level and
                   current_candle_high >= retrace_level and ema_is_inclined

// Exit condition
exit_condition = (strategy.position_size > 0 and prev_candle_red) or (strategy.position_size > 0 and current_candle_low < prev_candle_low)

// Ensure only one trade is open at a time
single_trade_condition = strategy.position_size == 0

// Plot EMA for visualization
plot(ema_44, color=color.blue, title="44 EMA")

// Plot conditions for debugging
plotshape(series=entry_condition and single_trade_condition, location=location.belowbar, color=color.green, style=shape.labelup, text="Buy")
plotshape(series=exit_condition, location=location.abovebar, color=color.red, style=shape.labeldown, text="Sell")

// Print entry condition value on chart
var label entry_label = na
if (entry_condition and single_trade_condition)
    entry_label := label.new(bar_index, low, text="Entry Condition: TRUE", color=color.green, textcolor=color.white, size=size.small, yloc=yloc.belowbar)
else
    entry_label := label.new(bar_index, high, text="Entry Condition: FALSE", color=color.red, textcolor=color.white, size=size.small, yloc=yloc.abovebar)

// Debugging: Plot retrace level and other key values
plot(retrace_level, color=color.orange, title="Retrace Level")
plot(prev_candle_high, color=color.purple, title="Previous Candle High")
plot(candle_before_prev_high, color=color.yellow, title="Candle Before Previous High")

// Trigger buy order if entry condition and single trade condition are met
if (entry_condition and single_trade_condition)
    strategy.entry("Buy", strategy.long)

// Trigger sell order if exit condition is met
if (exit_condition)
    strategy.close("Buy")