
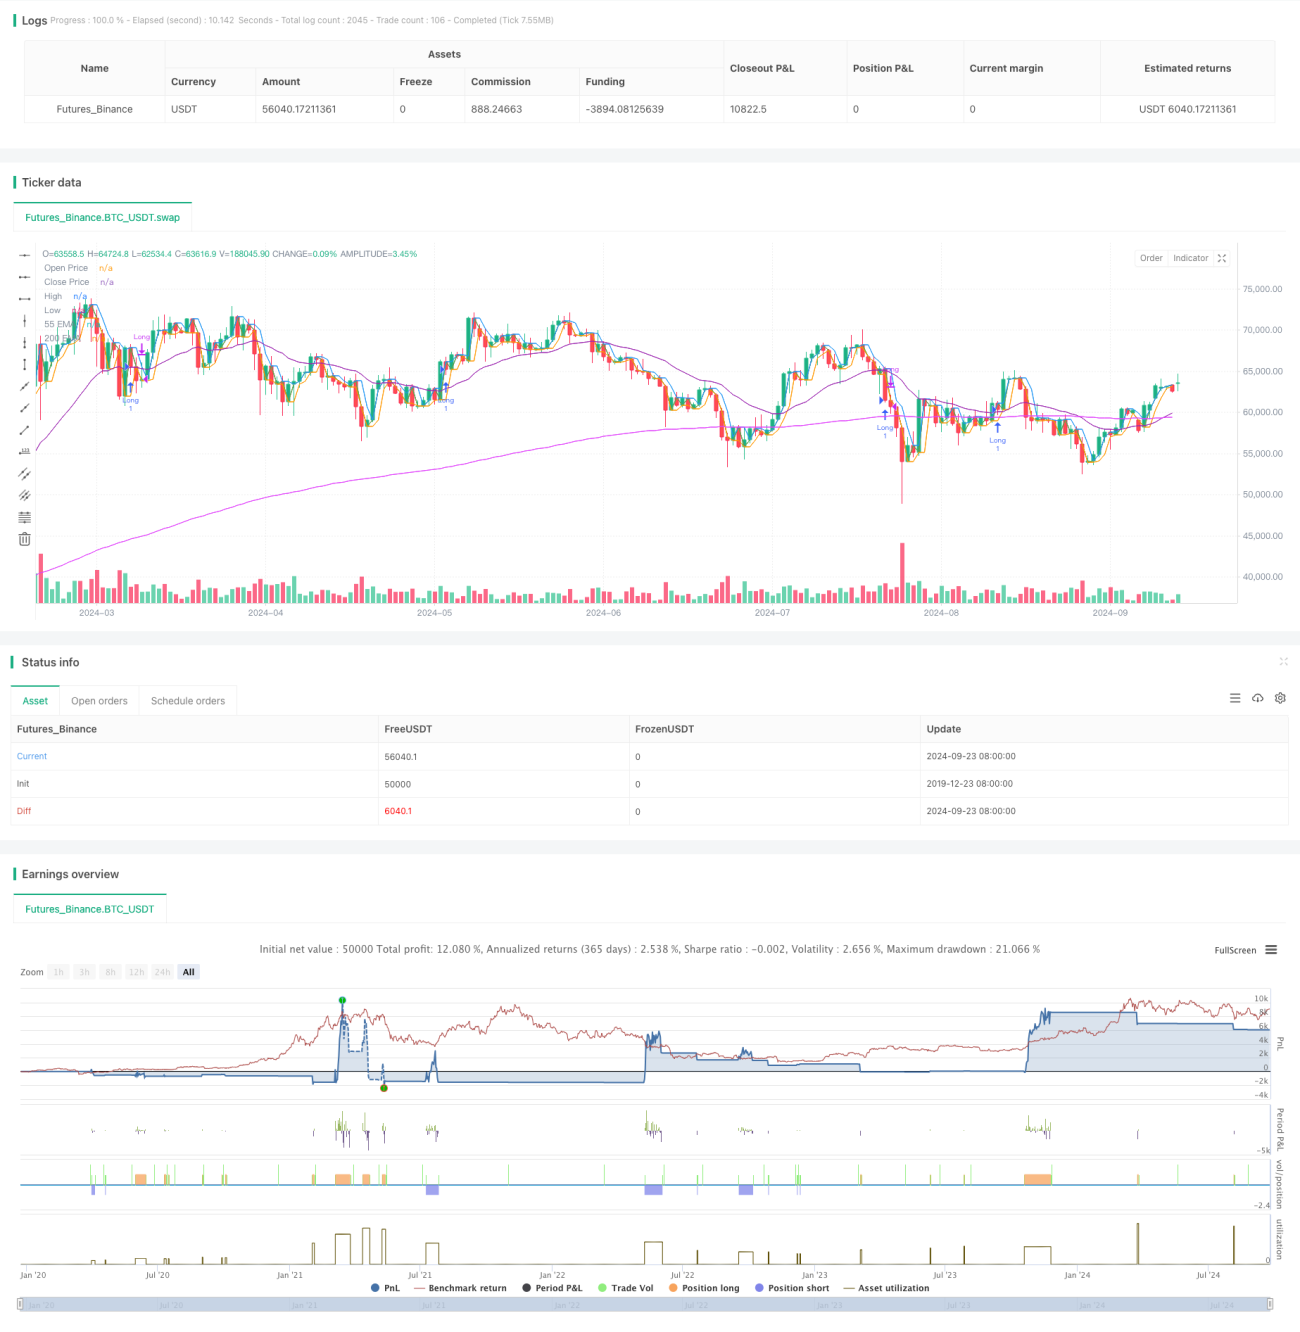
동적 추세 추적 EMA 교차 전략은 지수 이동 평균 ((EMA) 을 결합한, 저항 지점과 추세 추적 원칙을 뒷받침하는 정량 거래 전략이다. 이 전략은 주로 단기 및 장기 EMA의 교차를 사용하여 시장 추세를 판단하고, 높은 낮은 점의 돌파구를 결합하여 진입 시기를 찾는다. 전략은 또한 스톱, 스로프 및 추적 스로프와 같은 위험 관리 메커니즘을 포함하고 있으며, 시장 추세를 포착하고 위험을 통제하기 위해 고안되었다.
추세 판단: 55주기 EMA와 200주기 EMA의 상대적인 위치를 사용하여 시장 추세를 결정한다. 55주기 EMA가 200주기 EMA 위에 있을 때, 상승 추세로 판단하고, 반대로 하향 추세로 판단한다.
출입 신호:
출전 조건:
위험 관리:
트렌드 추적: 이 전략은 EMA 교차와 하위 하위 돌파를 통해 시장의 추세를 효과적으로 포착하여 수익 기회를 향상시킵니다.
동적 적응: 간단한 이동 평균 (SMA) 대신 EMA를 사용하여 전략이 시장 변화에 더 빠르게 적응할 수 있도록 한다.
다중 확인: 트렌드 판단, 가격 돌파구, EMA 교차 등 다중 조건과 결합하여 잘못된 신호의 가능성을 낮춘다.
위험 제어: 내장된 스톱, 스로스 및 추적 스로스 메커니즘은 위험을 제어하고 수익을 잠금하는 데 도움이됩니다.
시각적 도움말: 전략은 차트에 입력 및 출력 신호를 표시하여 거래자가 직관적으로 이해하고 분석에 도움이 됩니다.
유연성: 입력을 통해 사용자는 다른 시장과 개인 취향에 따라 전략을 조정할 수 있습니다.
위축 시장 위험: 위축 시장 또는 위축 시장에서 잘못된 신호가 자주 발생하여 과도한 거래와 손실이 발생할 수 있습니다.
지연성: EMA는 본질적으로 지연된 지표이며, 급격한 변동성 시장에서 가장 좋은 진입 또는 출구 시기를 놓칠 수 있다.
매개 변수 감수성: 전략 성능은 EMA 주기, 높은 낮은 시점 주기 등의 매개 변수의 설정에 크게 의존하며, 다른 시장에는 다른 최적 매개 변수가 필요할 수 있다.
트렌드 역전 위험: 강력한 트렌드 역전 시, 전략은 충분히 빠르게 반응하지 않을 수 있으며, 더 큰 회수로 이어질 수 있다.
기술적인 지표에 지나치게 의존하는 것: 전략은 기본적 요소를 고려하지 않고, 중요한 뉴스나 사건이 발생했을 때 제대로 작동하지 않을 수 있습니다.
거래량 지표를 추가: 거래량 분석을 결합하면 특히 트렌드 강도 및 잠재적 인 반전을 판단 할 때 신호의 신뢰성을 향상시킬 수 있습니다.
변동율 필터를 도입합니다. ATR (진짜 파동폭) 또는 볼린저 밴드 (Bollinger Bands) 와 같은 지표를 추가하여 전략이 높은 변동성 환경에서 더 잘 작동하도록 도와줍니다.
최적화된 스톱 메커니즘: 다양한 시장 조건에 적응하기 위해 고정된 점수 스톱 대신 변동적 인 스톱을 사용하는 것을 고려할 수 있습니다.
다중 시간 프레임 분석: 더 긴 시간 프레임 분석을 도입하여 트렌드 판단의 정확도를 높이고 가짜 돌파구를 줄일 수 있습니다.
RSI 또는 MACD와 같은 시장 감정 지표에 추가하면 잠재적인 가짜 신호를 필터링 할 수 있습니다.
적응 파라미터: 전략이 최근 시장 조건에 따라 EMA 주기와 다른 파라미터를 자동으로 조정할 수 있는 메커니즘을 개발한다.
동적 추세를 추적하는 EMA 교차 전략은 EMA 교차와 가격 돌파를 통해 시장 추세를 포착하기 위해 여러 기술 지표를 결합한 정량 거래 시스템입니다. 이 전략의 장점은 추세에 대한 민감성과 내장 된 위험 관리 장치에 있습니다. 그러나 동시에 시장의 흔들림과 변수 최적화의 도전에 직면합니다.
/*backtest
start: 2019-12-23 08:00:00
end: 2024-09-24 08:00:00
period: 1d
basePeriod: 1d
exchanges: [{"eid":"Futures_Binance","currency":"BTC_USDT"}]
*/
//@version=5
strategy("gucci 1.0 ", overlay=true)
// Input parameters
boxClose = input(true, title="Enable on Box Close")
timeframe = input.timeframe("1", title="Timeframe")
highLowPeriod = input.int(2, title="High/Low Period")
ema55Period = input.int(21, title="55 EMA Period")
ema200Period = input.int(200, title="200 EMA Period")
takeProfitTicks = input.int(55, title="Take Profit (in Ticks)")
stopLossTicks = input.int(30, title="Stop Loss (in Ticks)")
trailingStopTicks = input.int(25, title="Trailing Stop (in Ticks)")
// Security data
openPrice = request.security(syminfo.tickerid, timeframe, open)
closePrice = request.security(syminfo.tickerid, timeframe, close)
// Calculate high and low for the user-defined period
highCustomPeriod = ta.highest(closePrice, highLowPeriod)
lowCustomPeriod = ta.lowest(closePrice, highLowPeriod)
// Calculate customizable EMAs
ema55 = ta.ema(closePrice, ema55Period)
ema200 = ta.ema(closePrice, ema200Period)
// Plotting the open, close, high/low, and EMAs for reference
plot(openPrice, color=color.red, title="Open Price")
plot(closePrice, color=color.green, title="Close Price")
plot(highCustomPeriod, color=color.blue, title="High", linewidth=1)
plot(lowCustomPeriod, color=color.orange, title="Low", linewidth=1)
plot(ema55, color=color.purple, title="55 EMA", linewidth=1)
plot(ema200, color=color.fuchsia, title="200 EMA", linewidth=1)
// Determine trend direction
bullishTrend = ema55 > ema200
bearishTrend = ema55 < ema200
// Define entry conditions
longCondition = bullishTrend and ta.crossover(closePrice, lowCustomPeriod) and ta.crossover(closePrice, ema55)
shortCondition = bearishTrend and ta.crossunder(closePrice, highCustomPeriod) and ta.crossunder(closePrice, ema55)
// Entry conditions and auto take profit, stop loss, and trailing stop
if (boxClose)
if (longCondition)
takeProfitPriceLong = closePrice + takeProfitTicks * syminfo.mintick
stopLossPriceLong = closePrice - stopLossTicks * syminfo.mintick
strategy.entry("Long", strategy.long)
strategy.exit("Take Profit Long", "Long", limit=takeProfitPriceLong, stop=stopLossPriceLong, trail_offset=trailingStopTicks * syminfo.mintick)
// Plot visual signal for long entry
label.new(bar_index, closePrice, "Buy", color=color.green, textcolor=color.white, style=label.style_label_up, size=size.small)
// Send alert for long entry
alert("Long entry signal - price: " + str.tostring(closePrice), alert.freq_once_per_bar)
if (shortCondition)
takeProfitPriceShort = closePrice - takeProfitTicks * syminfo.mintick
stopLossPriceShort = closePrice + stopLossTicks * syminfo.mintick
strategy.entry("Short", strategy.short)
strategy.exit("Take Profit Short", "Short", limit=takeProfitPriceShort, stop=stopLossPriceShort, trail_offset=trailingStopTicks * syminfo.mintick)
// Plot visual signal for short entry
label.new(bar_index, closePrice, "Sell", color=color.red, textcolor=color.white, style=label.style_label_down, size=size.small)
// Send alert for short entry
alert("Short entry signal - price: " + str.tostring(closePrice), alert.freq_once_per_bar)
// Optional: Define exit conditions
longExitCondition = bearishTrend or ta.crossunder(closePrice, ema55)
shortExitCondition = bullishTrend or ta.crossover(closePrice, ema55)
if (longExitCondition)
strategy.close("Long")
// Plot visual signal for long exit
label.new(bar_index, closePrice, "Sell Exit", color=color.red, textcolor=color.white, style=label.style_label_down, size=size.small)
// Send alert for long exit
alert("Long exit signal - price: " + str.tostring(closePrice), alert.freq_once_per_bar)
if (shortExitCondition)
strategy.close("Short")
// Plot visual signal for short exit
label.new(bar_index, closePrice, "Buy Exit", color=color.green, textcolor=color.white, style=label.style_label_up, size=size.small)
// Send alert for short exit
alert("Short exit signal - price: " + str.tostring(closePrice), alert.freq_once_per_bar)