EMA, SMA, CCI, ATR, 이동평균 완벽 정렬 전략 및 트렌드 매직 인디케이터 자동 트레이딩 시스템

EMA SMA CCI ATR
생성 날짜: 2024-09-26 15:52:31 마지막으로 수정됨: 2024-09-26 15:52:31
복사: 0 클릭수: 675
avatar of ChaoZhang ChaoZhang
1
집중하다
1617
수행원

EMA, SMA, CCI, ATR, 이동평균 완벽 정렬 전략 및 트렌드 매직 인디케이터 자동 트레이딩 시스템

개요

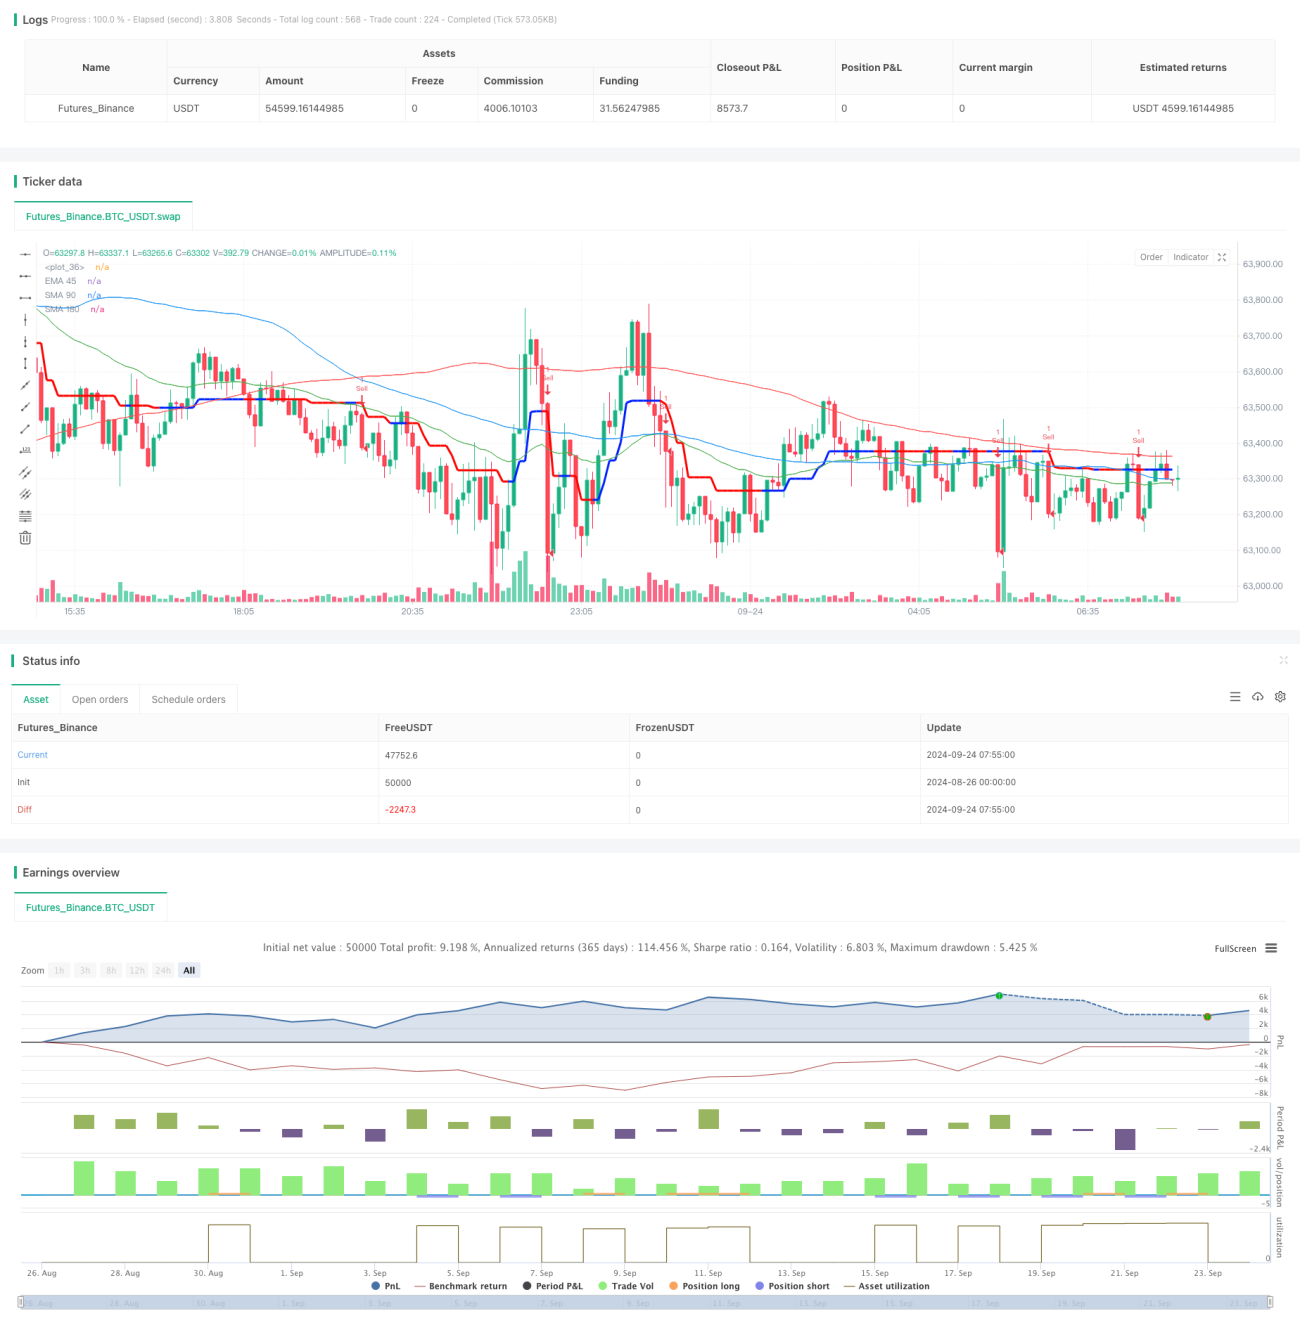
이 전략은 평행선 완벽한 배열과 트렌드 마지컬을 결합하여 시장의 흐름을 포착한다. 그것은 세 개의 이동 평균 (EMA45, SMA90, SMA180) 과 CCI 및 ATR을 기반으로 계산한 트렌드 마지컬을 사용합니다. 전략의 핵심은 평행선 완벽한 배열을 식별하는 데 있으며, 트렌드 마지컬의 색상의 변화와 결합하여 트렌드 반전을 확인하여 거래 신호를 생성합니다.

전략 원칙

이 전략은 다음과 같은 몇 가지 핵심 요소를 기반으로 작동합니다.

  1. 평균선 완벽한 배열: EMA45, SMA90 및 SMA180의 세 개의 평균선을 사용하여, 특정 순서에 따라 배열되면 ((다중 머리: EMA45 > SMA90 > SMA180; 빈 머리: EMA45 < SMA90 < SMA180), 트렌드를 설정하는 강력한 신호로 간주됩니다.

  2. 트렌드 마법 지표: 이것은 CCI (상품 통로 지수) 와 ATR (진정한 파도) 를 기반으로 한 사용자 정의 지표입니다. 그것은 색상 변화를 통해 잠재적인 트렌드 반전을 나타냅니다.

  3. 입시 조건: 평균선이 완벽한 배열과 트렌드 마지컬 색상의 변화가 동시에 충족될 때만 거래 신호가 발생한다. 이것은 강한 트렌드가 형성될 때만 거래를 보장한다.

  4. 위험 관리: 전략은 위험의 수익비율에 기반한 중지 손실과 수익 목표 사용. 중지 손실은 입시시 SMA90 수준으로 설정되며 수익 목표는 위험의 1.5 배로 설정됩니다.

전략적 이점

  1. 트렌드 추적: 여러 지표를 결합하여 전략은 중·장기 트렌드를 효과적으로 포착하고, 잘못된 신호를 줄일 수 있습니다.

  2. 위험 관리: 고정된 스톱 로즈와 리스크에 기반한 수익 목표가 포함된 내장된 위험 관리 메커니즘은 각 거래의 위험을 제어하는 데 도움이 됩니다.

  3. 유연성: 전략은 사용자가 CCI 주기, ATR 곱하기 및 이동 평균 주기와 같은 다양한 매개 변수를 조정할 수 있도록 허용합니다.

  4. 시각화: 전략은 트렌드 마법 지표와 이동 평균을 차트에 그려서 거래자가 시장 추세를 직관적으로 분석할 수 있도록합니다.

전략적 위험

  1. 뒤떨어짐: 이동 평균과 다른 뒤떨어지는 지표가 사용됨에 따라 전략은 트렌드 초기에 일부 기회를 놓칠 수 있습니다.

  2. 흔들리는 시장: 가로판 또는 흔들리는 시장에서, 전략은 자주 잘못된 신호를 생성하여 과도한 거래로 이어질 수 있다.

  3. 고정 스톱: 고정 SMA90을 스톱으로 사용하는 것은 경우에 따라 너무 느슨하게 잠재적인 손실을 증가시킬 수 있습니다.

  4. 매개 변수 민감성: 전략의 성능은 매개 변수 설정에 민감할 수 있으며, 신중하게 최적화 및 재검토가 필요합니다.

전략 최적화 방향

  1. 동적 스톱: 트래킹 스톱을 구현하는 것을 고려하고, 가격 이동에 따라 스톱 수준을 조정하여 이익을 더 잘 보호하십시오.

  2. 시장 상태 필터: 변동성 또는 트렌드 강도 필터를 도입하여 다양한 시장 조건에 따라 전략 행동을 조정한다.

  3. 시간 프레임 분석: 신호의 신뢰성을 높이고 가짜 신호를 줄이기 위해 여러 시간 프레임 분석을 통합한다.

  4. 양적 지표: 트랜드를 확인하고 반전 식별을 강화하기 위해 거래량 분석이나 다른 양적 지표를 추가하십시오.

  5. 기계 학습 최적화: 기계 학습 알고리즘을 사용하여 변수를 동적으로 조정하여 변화하는 시장 조건에 적응합니다.

요약하다

이 일률적인 완벽한 배열과 트렌드 마법 지표를 결합한 자동 거래 전략은 잠재적인 트렌드 추적 방법을 보여줍니다. 여러 기술적 지표를 통합하여 강력한 시장 추세를 포착하는 동시에 내장 된 위험 관리 장치를 통해 위험을 제어하는 것을 목표로합니다.

전략 소스 코드
/*backtest
start: 2024-08-26 00:00:00
end: 2024-09-24 08:00:00
period: 5m
basePeriod: 5m
exchanges: [{"eid":"Futures_Binance","currency":"BTC_USDT"}]
*/

// This source code is subject to the terms of the Mozilla Public License 2.0 at https://mozilla.org/MPL/2.0/
// © PakunFX

//@version=5
strategy("Trend Magic with EMA, SMA, and Auto-Trading", shorttitle="TM_Trading", overlay=true, format=format.price, precision=2)

// Inputs
period = input.int(21, "CCI period")
coeff = input.float(1.0, "ATR Multiplier")
AP = input.int(7, "ATR Period")
riskRewardRatio = input.float(1.5, "Risk/Reward Ratio")  // Risk/Reward Ratio for take profit

// Calculations
ATR = ta.sma(ta.tr, AP)
src = input(close)
upT = low - ATR * coeff
downT = high + ATR * coeff
var MagicTrend = 0.0
MagicTrend := ta.cci(src, period) >= 0 ? (upT < nz(MagicTrend[1]) ? nz(MagicTrend[1]) : upT) : (downT > nz(MagicTrend[1]) ? nz(MagicTrend[1]) : downT)

// Define colors for Trend Magic
color1 = ta.cci(src, period) >= 0 ? color.rgb(0, 34, 252) : color.rgb(252, 4, 0)
isBlue = ta.cci(src, period) >= 0
isRed = ta.cci(src, period) < 0

// Convert bool to float (1 for true, 0 for false)
isBlueFloat = isBlue ? 1 : 0
isRedFloat = isRed ? 1 : 0

// Moving Averages
ema45 = ta.ema(close, 45)
sma90 = ta.sma(close, 90)
sma180 = ta.sma(close, 180)

// Plot Trend Magic
plot(MagicTrend, color=color1, linewidth=3)

// Alerts
alertcondition(ta.cross(close, MagicTrend), title="Cross Alert", message="Price - MagicTrend Crossing!")
alertcondition(ta.crossover(low, MagicTrend), title="CrossOver Alarm", message="BUY SIGNAL!")
alertcondition(ta.crossunder(high, MagicTrend), title="CrossUnder Alarm", message="SELL SIGNAL!")

// Perfect Order conditions
bullishPerfectOrder = ema45 > sma90 and sma90 > sma180  // Bullish Perfect Order
bearishPerfectOrder = ema45 < sma90 and sma90 < sma180  // Bearish Perfect Order

// Trend Magic color change detection
trendMagicTurnedBlue = ta.crossover(isBlueFloat, isRedFloat)  // Red to Blue crossover (For long entry)
trendMagicTurnedRed = ta.crossunder(isBlueFloat, isRedFloat)  // Blue to Red crossover (For short entry)

// Variables to store SMA90 at the entry
var float longSma90 = na
var float shortSma90 = na

// Trading logic based on Perfect Order and color change
longCondition = bullishPerfectOrder and trendMagicTurnedBlue  // Buy when Perfect Order is bullish and Trend Magic turns red to blue
shortCondition = bearishPerfectOrder and trendMagicTurnedRed  // Sell when Perfect Order is bearish and Trend Magic turns blue to red

// Strategy Entry
if (longCondition)
    strategy.entry("Buy", strategy.long)
    longSma90 := sma90  // Store SMA90 at entry for long position

if (shortCondition)
    strategy.entry("Sell", strategy.short)
    shortSma90 := sma90  // Store SMA90 at entry for short position

// Stop-Loss and Take-Profit calculations
// For Long Positions: stop at SMA90 (fixed at entry), take profit at 1.5x risk
if (longCondition and not na(longSma90))
    longStopLoss = longSma90  // Use SMA90 at the time of entry
    longRisk = close - longSma90  // Calculate risk
    longTakeProfit = close + longRisk * riskRewardRatio  // Calculate take profit
    strategy.exit("Take Profit/Stop Loss", "Buy", stop=longStopLoss, limit=longTakeProfit)

// For Short Positions: stop at SMA90 (fixed at entry), take profit at 1.5x risk
if (shortCondition and not na(shortSma90))
    shortStopLoss = shortSma90  // Use SMA90 at the time of entry
    shortRisk = shortSma90 - close  // Calculate risk
    shortTakeProfit = close - shortRisk * riskRewardRatio  // Calculate take profit
    strategy.exit("Take Profit/Stop Loss", "Sell", stop=shortStopLoss, limit=shortTakeProfit)

// Plot Moving Averages
plot(ema45, color=color.green, title="EMA 45")
plot(sma90, color=color.blue, title="SMA 90")
plot(sma180, color=color.red, title="SMA 180")