더블 이동 평균을 기반으로 한 골든 크로스 적응형 위험 관리 전략

1
Follow
1781
Followers
개요
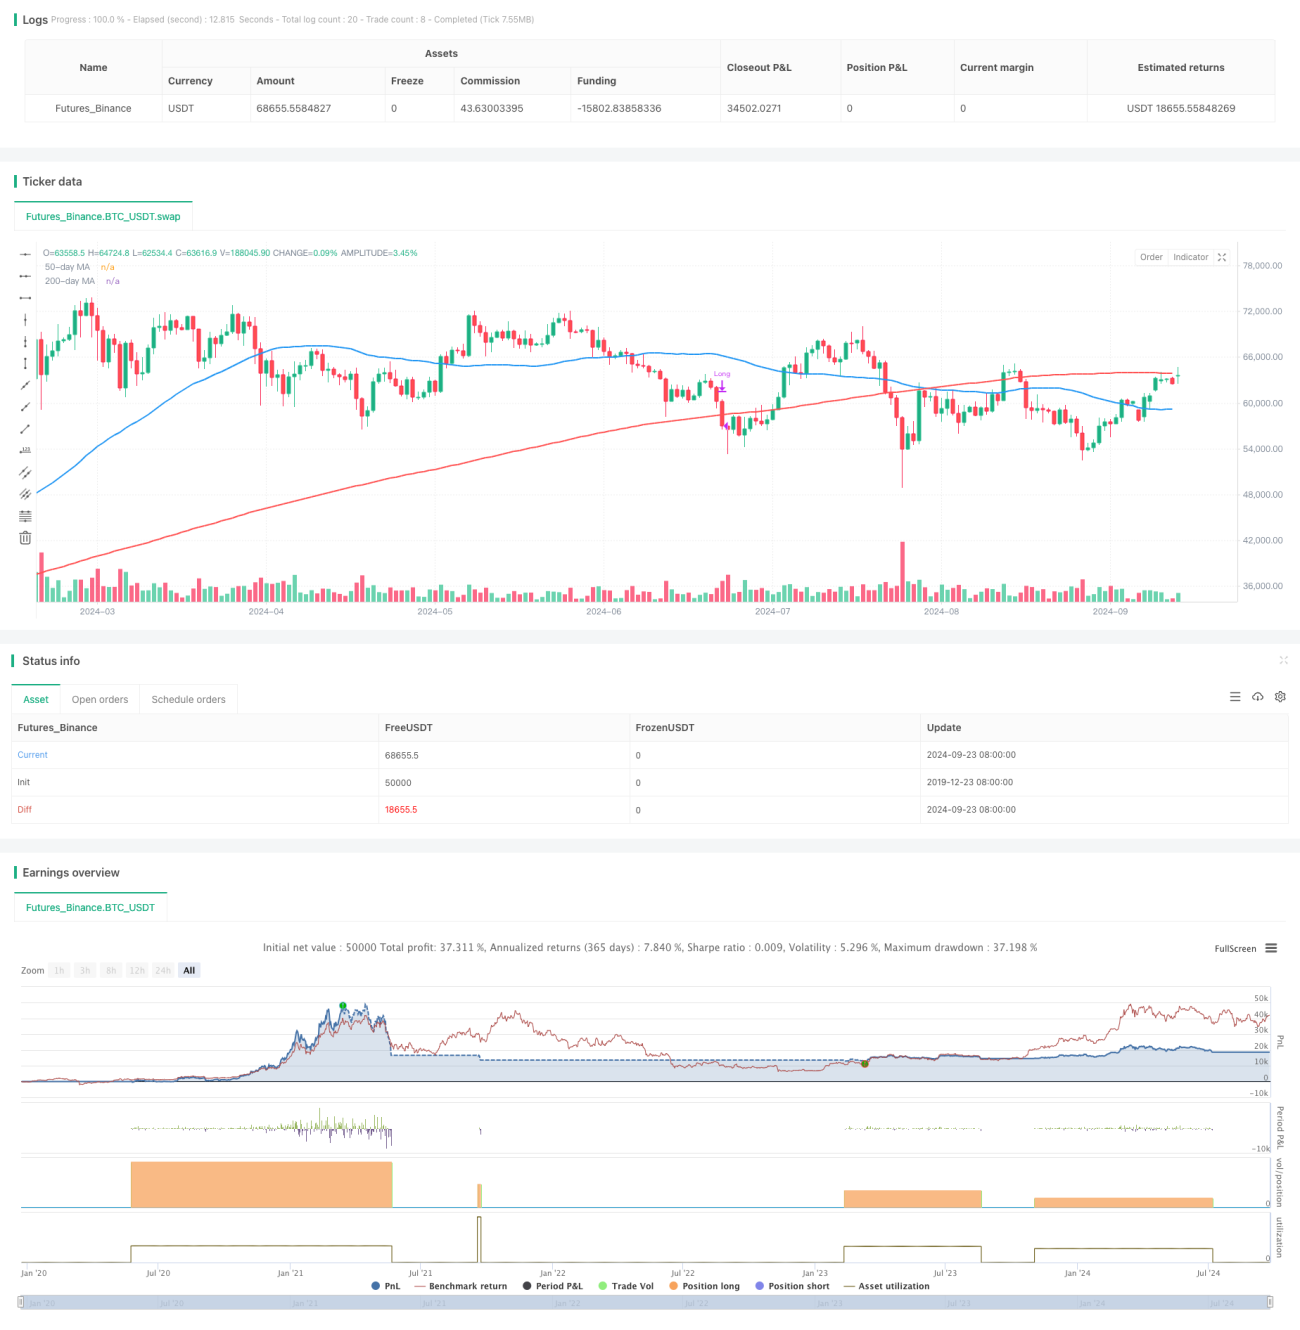
이 전략은 50일 및 200일 간단한 이동 평균 (SMA) 을 사용하여 트렌드를 식별하고 50일 평균에서 200일 평균선을 통과하면 구매 신호를 발생시킵니다. 동시에, 이 전략은 2.5%의 계좌 총액을 기반으로 하는 위험 제어 방법을 채택하고, 거래 당 거래의 포지션 크기를 동적으로 계산하고, 200일 평균선에 대한 상대적인 비율을 사용하여 이익을 보호하기 위해 스톱을 사용합니다.
전략 원칙
- 입수 신호: 50일 평균선에서 200일 평균선을 통과했을 때 ((금색 교차), 구매 신호를 유발한다.
- 위험 관리: 거래 당 위험은 총 계좌 가치의 2.5%를 초과하지 않습니다.
- 포지션 계산: 위험 금액과 스톱로스 거리를 기반으로 거래 당 포지션 크기를 동적으로 계산한다.
- 스톱로스 설정: 스톱로스 가격을 200일 평균선 아래 1.5%로 설정한다.
- 출구 조건: 가격이 200일 평균선 아래로 떨어지면 평점으로 거래를 종료한다.
전략적 이점
- 트렌드 추적: 금의 크로스를 사용하여 강력한 상승 추세를 포착하여 수익 기회를 향상시킵니다.
- 위험 제어: 비율 위험 관리를 사용하여 거래 당 위험 경로를 효과적으로 제어합니다.
- 동적 포지션: 시장의 변동성에 따라 포지션 크기를 자동으로 조정하여 위험과 수익 사이의 균형을 잡습니다.
- 유연한 스톱: 상대적인 스톱을 사용하여 시장의 변동에 따라 자동으로 조정하여 수익을 보호하고 가격에 충분한 변동 공간을 제공합니다.
- 뚜렷한 출전: 뚜렷한 출전 조건을 설정하고, 주관적인 판단으로 인한 망설임을 피한다.
전략적 위험
- 가짜 돌파구: 불안한 시장에서 종종 가짜 신호를 유발하여 연속으로 작은 손실을 초래할 수 있습니다.
- 뒤처짐: 이동 평균은 본질적으로 뒤처진 지표이며, 트렌드 초기의 큰 상승을 놓칠 수 있습니다.
- 큰 하락: 하향으로 큰 하락이 발생할 경우 실제 정지는 기본 2.5%의 위험 제한을 초과할 수 있습니다.
- 과도한 거래: 수평 시장에서 평균선은 자주 교차하여 불필요한 거래 비용을 증가시킬 수 있습니다.
- 단일 기술 지표: 이동 평균에만 의존하면 다른 중요한 시장 정보를 무시할 수 있습니다.
전략 최적화 방향
- 필터링 메커니즘을 도입: 거래량, 변동성 등의 지표를 추가하여 더 신뢰할 수 있는 거래 신호를 필터링 할 수 있습니다.
- 진입 시기를 최적화: 다른 기술 지표 (RSI, MACD 등) 와 결합하여 트렌드를 확인하고, 가짜 돌파구를 줄인다.
- 동적 조정 파라미터: 다양한 시장 주기에 따라 평균 선주기를 자동으로 조정하여 전략 적응성을 향상시킵니다.
- 더 많은 스톱 메커니즘: 동적 스톱 조건을 설정하여 강세를 보이는 상황에서 더 많은 수익을 고정합니다.
- 분산 위험: 여러 개의 관련 없는 시장에서 동시에 이 전략을 적용하여 체계적인 위험을 줄이는 것을 고려한다.
요약하다
이 쌍평선 골드 크로스 기반의 자기 적응 위험 관리 전략은 고전적인 기술 분석 방법과 현대적인 위험 관리 기술을 결합하여 거래자에게 비교적 안정적인 거래 시스템을 제공합니다. 중장기 트렌드를 포착 할 수있을뿐만 아니라 위험을 효과적으로 제어 할 수 있으며 안정적인 수익을 추구하는 투자자에게 적합합니다. 그러나 이 전략을 사용하는 거래자는 여전히 시장 변화를 면밀히 관찰하고 실제 거래 성과에 따라 변수를 지속적으로 최적화하여 최적의 위험-수익 비율을 달성해야합니다.
Source
Pine
Related strategies
Comment
All comments (0)
No data
- 1