EMA/MACD/RSI 크로스오버 전략

1
Follow
1780
Followers
개요
EMA/MACD/RSI 교차 전략은 여러 기술 지표를 결합한 양적 거래 전략이다. 이 전략은 주로 지수 이동 평균 ((EMA), 이동 평균 동향 분산 지표 ((MACD) 및 상대적으로 강한 지수 ((RSI) 의 교차 신호를 사용하여 시장 추세를 판단하고 거래 신호를 생성한다. 전략은 또한 동적 스톱 손실을 설정하고 위험을 효과적으로 제어하기 위해 평균 실제 파장을 ((ATR) 도입했다.
전략 원칙
이 전략의 핵심 원칙은 여러 지표의 교차 및 조합을 통해 입출장 및 출장 시간을 결정하는 것입니다.
- EMA 교차: 빠른 EMA와 느린 EMA의 교차는 단기 트렌드 변화를 잡기 위해 사용됩니다.
- MACD 교차: MACD 선과 신호 선의 교차는 중간 트렌드 전환을 확인하기 위해 사용됩니다.
- RSI 필터: RSI 지표를 사용하여 잠재적 인 가짜 브레이크를 필터링하고 RSI가 과매매 또는 과매매 영역에 있지 않은 경우에만 거래를 수행합니다.
- ATR 중지: ATR을 사용하여 동적 중지 설정을 사용하여 시장의 변동에 따라 중지 위치를 조정합니다.
구매 조건은 빠른 EMA에서 느린 EMA 또는 MACD 라인을 통과하는 신호 라인을 통과하는 것과 동시에 RSI가 초과 판매 수준보다 높습니다. 판매 조건은 반대입니다. 전략은 또한 재개 포지션을 피하기 위해 현재의 포지션 상태를 확인하여 자금 활용 효율성을 높입니다.
전략적 이점
- 다중 지표 결합: EMA, MACD 및 RSI를 결합하여 전략은 거래 신호를 다양한 각도에서 확인하고 잘못된 판단의 위험을 줄일 수 있습니다.
- 트렌드 추적과 반전 재배치: EMA와 MACD의 사용은 트렌드를 포착하는 동시에 잠재적인 반전 기회를 발견할 수 있습니다.
- 다이내믹 리스크 관리: ATR 기반의 다이내믹 스톱을 사용하여 스톱 포인트를 시장의 변동성에 따라 자동으로 조정할 수 있습니다.
- 유연성: 전략의 매개 변수는 다양한 시장과 시간 프레임에 따라 조정될 수 있으며, 적응력이 강하다.
- 과도한 거래를 피하십시오: 기존 지분을 검사하여 재개점을 피하여 거래 빈도와 비용을 제어하는 데 도움이됩니다.
전략적 위험
- 흔들림 시장의 부실성: 가로 수평 흔들림 시장에서, 과도한 거래와 손실로 이어지는 빈번한 잘못된 신호가 발생할 수 있습니다.
- 변수 민감성: 전략 성능은 EMA, MACD 및 RSI의 변수 설정에 크게 의존하며, 시장에 따라 자주 조정될 수 있습니다.
- 지연성: 지연 지표로서, EMA와 MACD는 급격히 변동하는 시장에서 적절하게 반응하지 않을 수 있다.
- 신호 충돌: 여러 지표가 서로 상반되는 신호를 줄 수 있어 의사결정이 더 어려워질 수 있습니다.
- 과도한 기술 분석 의존: 전략은 기본 요소를 고려하지 않고, 주요 뉴스 또는 사건의 영향으로 실패할 수 있습니다.
전략 최적화 방향
- 유동성 필터를 도입합니다. 높은 유동성 환경에서 전략 파라미터를 조정하거나 급격한 시장 변동에 대응하기 위해 거래를 중단하는 것을 고려할 수 있습니다.
- 트렌드 강도 판단을 높여: ADX와 같은 트렌드 강도 지표를 도입하여, 강한 트렌드 시장에서 더 적극적인 전략을 채택하고, 약한 트렌드 시장에서 더 보수적입니다.
- 최적화 된 중지 메커니즘: 현재 전략은 손실만 중지 설정이 있으며 ATR 또는 고정 비율 기반의 중지 메커니즘을 추가하여 수익을 잠금 할 수 있습니다.
- 시간 프레임 연동: 여러 시간 프레임에서 신호를 검증하는 것을 고려하여 거래 의사 결정의 신뢰성을 향상시킵니다.
- 거래량 분석에 추가: 가격 움직임을 확인하기 위해 OBV 또는 CMF와 같은 거래량 지표를 결합한다.
- 기계 학습 최적화: 기계 학습 알고리즘을 사용하여 지표 변수를 동적으로 조정하여 시장 변화에 대한 전략의 적응성을 향상시킵니다.
요약하다
EMA/MACD/RSI 크로스 전략은 다중 지표의 연동으로 거래 기회를 식별하고 위험을 관리하는 포괄적인 기술 분석 거래 시스템입니다. 이 전략의 주요 장점은 다차원 시장 분석 관점과 유연한 위험 관리 장치입니다. 그러나 사용자는 다양한 시장 환경에서 전략의 성과 차이에 주의를 기울이고 특정 거래 품종과 시장 상황에 대한 매개 변수를 최적화해야합니다.
Source
Pine
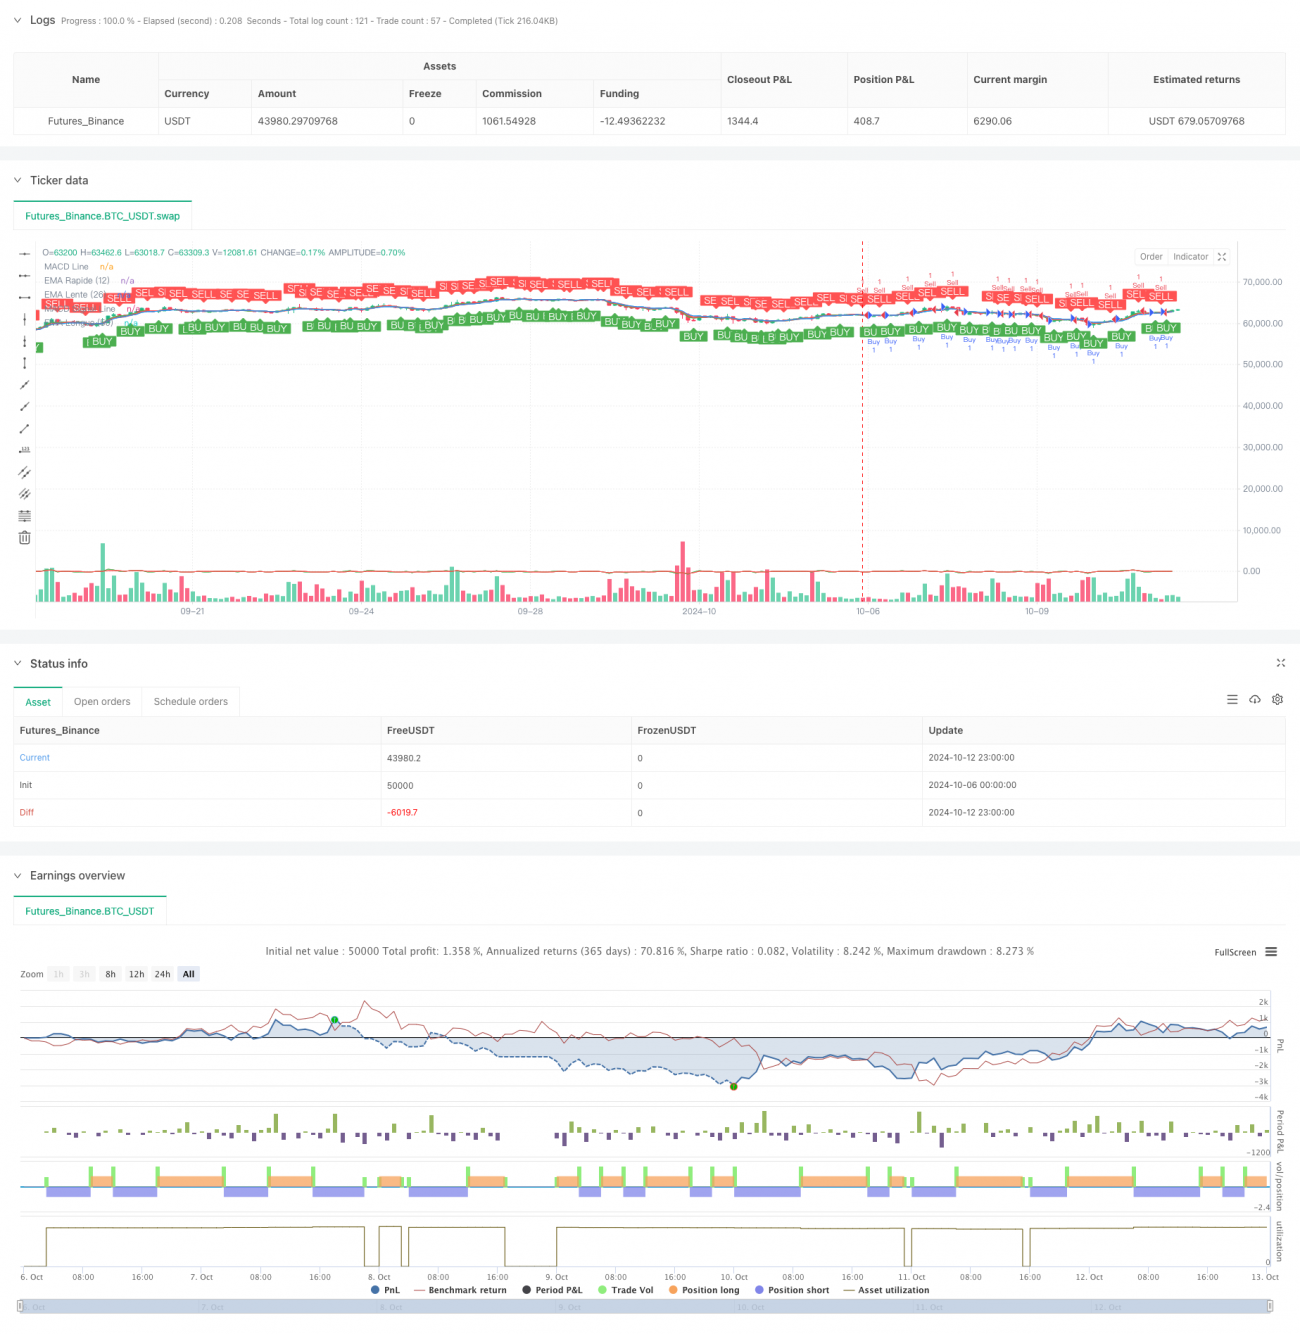
/*backtest
start: 2024-10-06 00:00:00
end: 2024-10-13 00:00:00
period: 3h
basePeriod: 3h
exchanges: [{"eid":"Futures_Binance","currency":"BTC_USDT"}]
*/

//@version=5
strategy("Mister Buy / sell signals", overlay=true, shorttitle="Mister Buy / sell signals")

// ─────────────────────────────────────────────────────────────Strategy parameters
Related strategies
Comment
All comments (0)
No data
- 1