다중 기술 지표를 기반으로 한 평균 회귀 추세 추종 전략

RSI BB EMA TA
생성 날짜: 2024-11-12 10:44:26 마지막으로 수정됨: 2024-11-12 10:44:26
복사: 0 클릭수: 492
avatar of ChaoZhang ChaoZhang
1
집중하다
1617
수행원

다중 기술 지표를 기반으로 한 평균 회귀 추세 추종 전략

개요

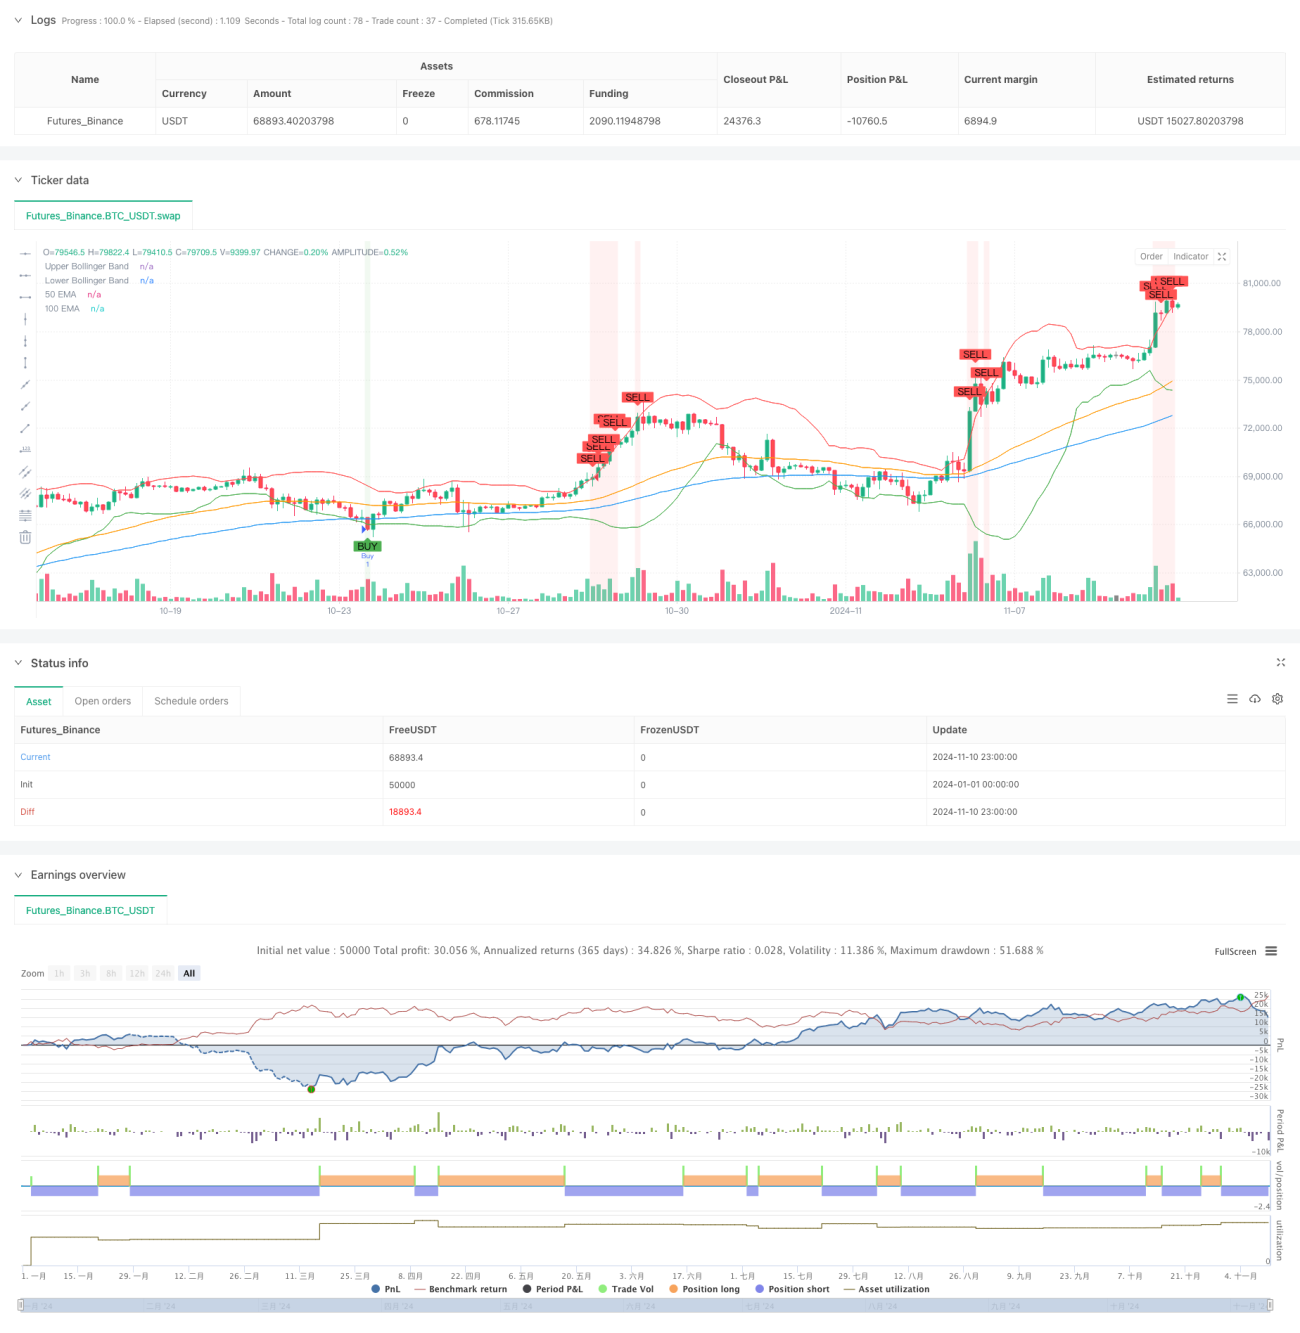
이 전략은 평균 회귀와 트렌드 추적을 결합 한 혼합 전략 시스템으로, RSI, 브린 밴드 및 다중 EMA 지표의 조합을 통해 시장의 과매매 과매매 기회를 포착합니다. 이 전략은 전통적인 기술 분석 지표에 기반하여 트렌드 확인과 범위 흔들림 판단을 증가시키고 전략의 정확성을 효과적으로 향상시킵니다.

전략 원칙

전략은 트레이드 신호를 확인하기 위해 3번의 검증 메커니즘을 사용합니다. 우선 RSI 지표를 통해 과매도 과매도 지역을 식별하고 RSI가 30 이하 또는 70 이하일 때 초기 신호를 트리거합니다. 다음으로, 부린 밴드 ((BB) 를 가격 변동 범위의 참고로 사용하여, 가격이 경로를 돌파하거나 경로를 벗어날 때 추가 신호를 확인합니다. 마지막으로 10050 일 EMA의 상대적 위치와 변동성을 통해 시장 추세를 판단하고, 트렌드 방향이 이전 두 신호와 일치하는 경우에만 거래를 수행합니다. 전략은 EMA의 변동률 판단을 추가하여 전체 시장을 식별합니다.

전략적 이점

  1. 여러 기술 지표의 크로스 검증으로 가짜 신호를 크게 줄일 수 있습니다.
  2. 과매매와 트렌드 추적을 결합하여 전략적 적응력을 향상시킵니다.
  3. 평균 변동률 판단을 도입하여 재조정 시장을 효과적으로 식별
  4. 전략적 모니터링과 최적화를 위한 명확한 시각화 효과
  5. 다양한 시장 환경에 적응할 수 있는 변수

전략적 위험

  1. 여러 지표로 인해 신호 지연이 발생할 수 있습니다.
  2. 급격한 변동성 시장에서 놓칠 수 있는 거래 기회
  3. 과도한 매개변수 최적화는 과적합으로 이어질 수 있습니다.
  4. EMA 트렌드 판단이 수평 시장에서 혼란 신호를 일으킬 수 있다 다양한 시간 주기 데이터를 재검토하여 전략의 안정성을 검증하고 적절한 스톱 스로드를 설정하여 위험을 제어하는 것이 좋습니다.

전략 최적화 방향

  1. 수요량 지표가 추가되었습니다.
  2. 적응 변수 조정 메커니즘을 도입
  3. 스톱톱 손실 관리 모듈을 추가합니다.
  4. 트렌드 강도 평가 시스템 개발
  5. 최적화된 EMA 변동률 계산 방법
  6. 시장 변동율 필터를 추가합니다.

요약하다

이 전략은 여러 기술 지표의 연동 작용을 통해 안정성을 보장하면서 전략의 유연성을 동시에 고려한다. 전략 논리는 명확하고, 구현 방법은 간단하며, 실용적인 가치가 좋다. 합리적인 매개 변수 최적화 및 위험 관리를 통해 전략은 다양한 시장 환경에서 안정적인 성능을 유지할 것으로 보인다.

전략 소스 코드
/*backtest
start: 2024-01-01 00:00:00
end: 2024-11-11 00:00:00
period: 3h
basePeriod: 3h
exchanges: [{"eid":"Futures_Binance","currency":"BTC_USDT"}]
*/

//@version=5
strategy("BTC Dominance Analysis Strategy (Improved)", overlay=true)

// Input Parameters
rsi_period = input(14, title="RSI Period")
bb_period = input(20, title="Bollinger Band Period")
bb_std_dev = input(2.0, title="Bollinger Std Dev")
ema_period = input(100, title="100 EMA Period")
ema_30_period = input(30, title="30 EMA Period")
ema_50_period = input(50, title="50 EMA Period")

// RSI Calculation
rsi_value = ta.rsi(close, rsi_period)

// Bollinger Bands Calculation
basis = ta.sma(close, bb_period)
dev = bb_std_dev * ta.stdev(close, bb_period)
upper_bb = basis + dev
lower_bb = basis - dev

// EMA Calculation
ema_100 = ta.ema(close, ema_period)
ema_30 = ta.ema(close, ema_30_period)
ema_50 = ta.ema(close, ema_50_period)

// Determine EMA trends
range_bound_ema = math.abs(ema_100 - ta.sma(ema_100, 10)) < ta.stdev(ema_100, 10)
uptrend_ema = ema_100 > ema_50
downtrend_ema = ema_100 < ema_50

// Long Condition: All 3 conditions must be met
// 1. RSI < 30
// 2. BTC Dominance < lower Bollinger Band
// 3. 100 EMA must be range-bound or in an uptrend (but NOT in a downtrend)
long_condition = (rsi_value < 30) and (close < lower_bb) and (range_bound_ema or uptrend_ema)

// Short Condition: All 3 conditions must be met
// 1. RSI > 70
// 2. BTC Dominance > upper Bollinger Band
// 3. 100 EMA must be range-bound or in a downtrend (but NOT in an uptrend)
short_condition = (rsi_value > 70) and (close > upper_bb) and (range_bound_ema or downtrend_ema)

// Plot Buy and Sell Signals for Debugging
plotshape(long_condition, title="Buy Signal", location=location.belowbar, color=color.green, style=shape.labelup, text="BUY")
plotshape(short_condition, title="Sell Signal", location=location.abovebar, color=color.red, style=shape.labeldown, text="SELL")

// Execute Buy Trade
if (long_condition)
    strategy.entry("Buy", strategy.long)

// Execute Sell Trade
if (short_condition)
    strategy.entry("Sell", strategy.short)

// Plot Bollinger Bands and EMA
plot(upper_bb, color=color.red, title="Upper Bollinger Band")
plot(lower_bb, color=color.green, title="Lower Bollinger Band")
plot(ema_100, color=color.blue, title="100 EMA")
plot(ema_50, color=color.orange, title="50 EMA")
// plot(rsi_value, "RSI", color=color.purple)

// Display background color for Buy and Sell signals
bgcolor(long_condition ? color.new(color.green, 90) : na, title="Buy Background")
bgcolor(short_condition ? color.new(color.red, 90) : na, title="Sell Background")