볼린저 밴드와 RSI를 결합한 적응형 트렌드 트레이딩 전략

1
Follow
1781
Followers
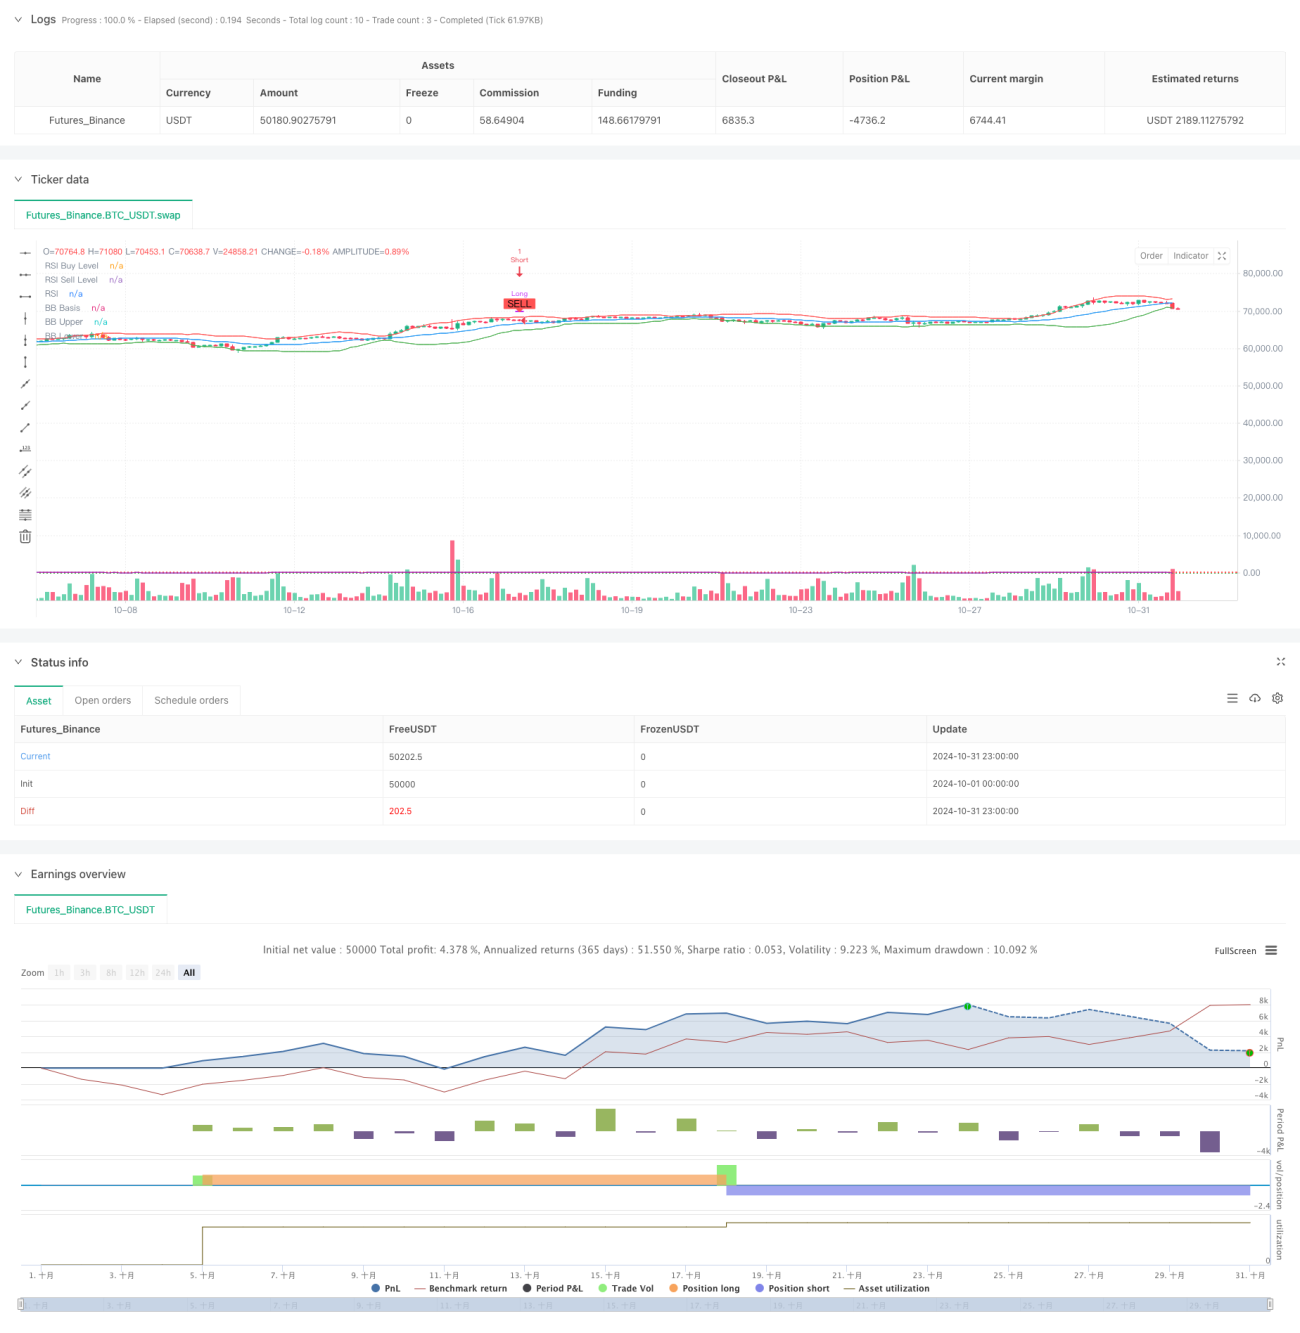
개요
이 전략은 여러 기술적 지표와 결합된 트렌드 추적 시스템으로, 부린 띠, RSI, MACD의 3가지 고전 지표의 조화를 통해 시장의 흔들림과 트렌드 전환 단계에서 거래 기회를 포착한다. 전략은 피라미드 형태의 포지션 방식을 채택하고, 엄격한 거래 간격 통제를 통해 위험을 관리한다.
전략 원칙
전략의 핵심 논리는 세 가지 신호 확인에 기반을 두고 있습니다.
- RSI 지표를 사용하여 과매매 지역을 식별합니다. RSI <45은 과매매로 간주되며, RSI>55은 과매매로 간주됩니다.
- 부린 띠 통로를 통해 가격 위치를 판단하고, 가격이 부린 띠에 접근하거나 부러지면 신호를 냅니다.
- MACD 골드 포크 데드 포크를 트렌드 확인으로 사용하여 RSI와 브린 밴드 신호에 공명 후 포지션을 개설합니다.
전략은 또한 최소 거래 간격 (<15주기) 을 설정하고, 과도한 거래를 피하며, 피라미드 형태의 포지션 관리를 채택한다.
전략적 이점
- 여러 기술 지표의 크로스 검증으로 가짜 신호를 크게 줄일 수 있습니다.
- 피라미드형 상장 제도는 자금 활용 효율성을 높였다.
- 최소 거래 간격을 설정하여 거래 빈도를 효과적으로 제어합니다.
- 지표 매개 변수는 조정 가능하며, 강한 적응력을 가지고 있습니다.
- 자동 평점 메커니즘으로 위험 틈을 제어
전략적 위험
- 여러 지표로 인해 신호 지연이 발생할 수 있습니다.
- 불안한 시장에서 거래가 자주 발생할 수 있습니다.
- 피라미드형 포지션은 트렌드가 바뀌면 더 큰 손실을 초래할 수 있다.
- 고정 RSI 마이너스는 모든 시장 환경에 적합하지 않을 수 있습니다.
전략 최적화 방향
- 시장의 변동성에 따라 동적으로 조정되는 적응된 RSI 마이너스를 도입합니다.
- 보조 확인으로 볼륨 표시기 추가
- 피라미드의 포지션 관리 알고리즘을 최적화
- 더 유연한 손해 방지 장치에 가입
- 시장의 주기적 특성을 고려하여 거래 간격을 동적으로 조정합니다.
요약하다
이 전략은 다중 기술 지표의 협동 협조를 통해 위험을 제어하면서 안정적인 수익을 추구한다. 약간의 뒤처짐이 있지만, 합리적인 매개 변수 최적화 및 위험 관리 메커니즘을 통해 전략은 더 나은 적응력과 안정성을 보여준다. 미래에는 적응 장치와 더 나은 포지션 관리를 도입하여 전략 성능을 더욱 향상시킬 수 있다.
Source
Pine
/*backtest
start: 2024-10-01 00:00:00
end: 2024-10-31 23:59:59
period: 3h
basePeriod: 3h
exchanges: [{"eid":"Futures_Binance","currency":"BTC_USDT"}]
*/

//@version=5
strategy("[ETH] Optimized Trend Strategy", shorttitle="Lorenzo-SuperScalping", overlay=true, pyramiding=3, initial_capital=100000, currency=currency.USD)

// === Input Parameters === //Strategy parameters
Related strategies
Comment
All comments (0)
No data
- 1