개요
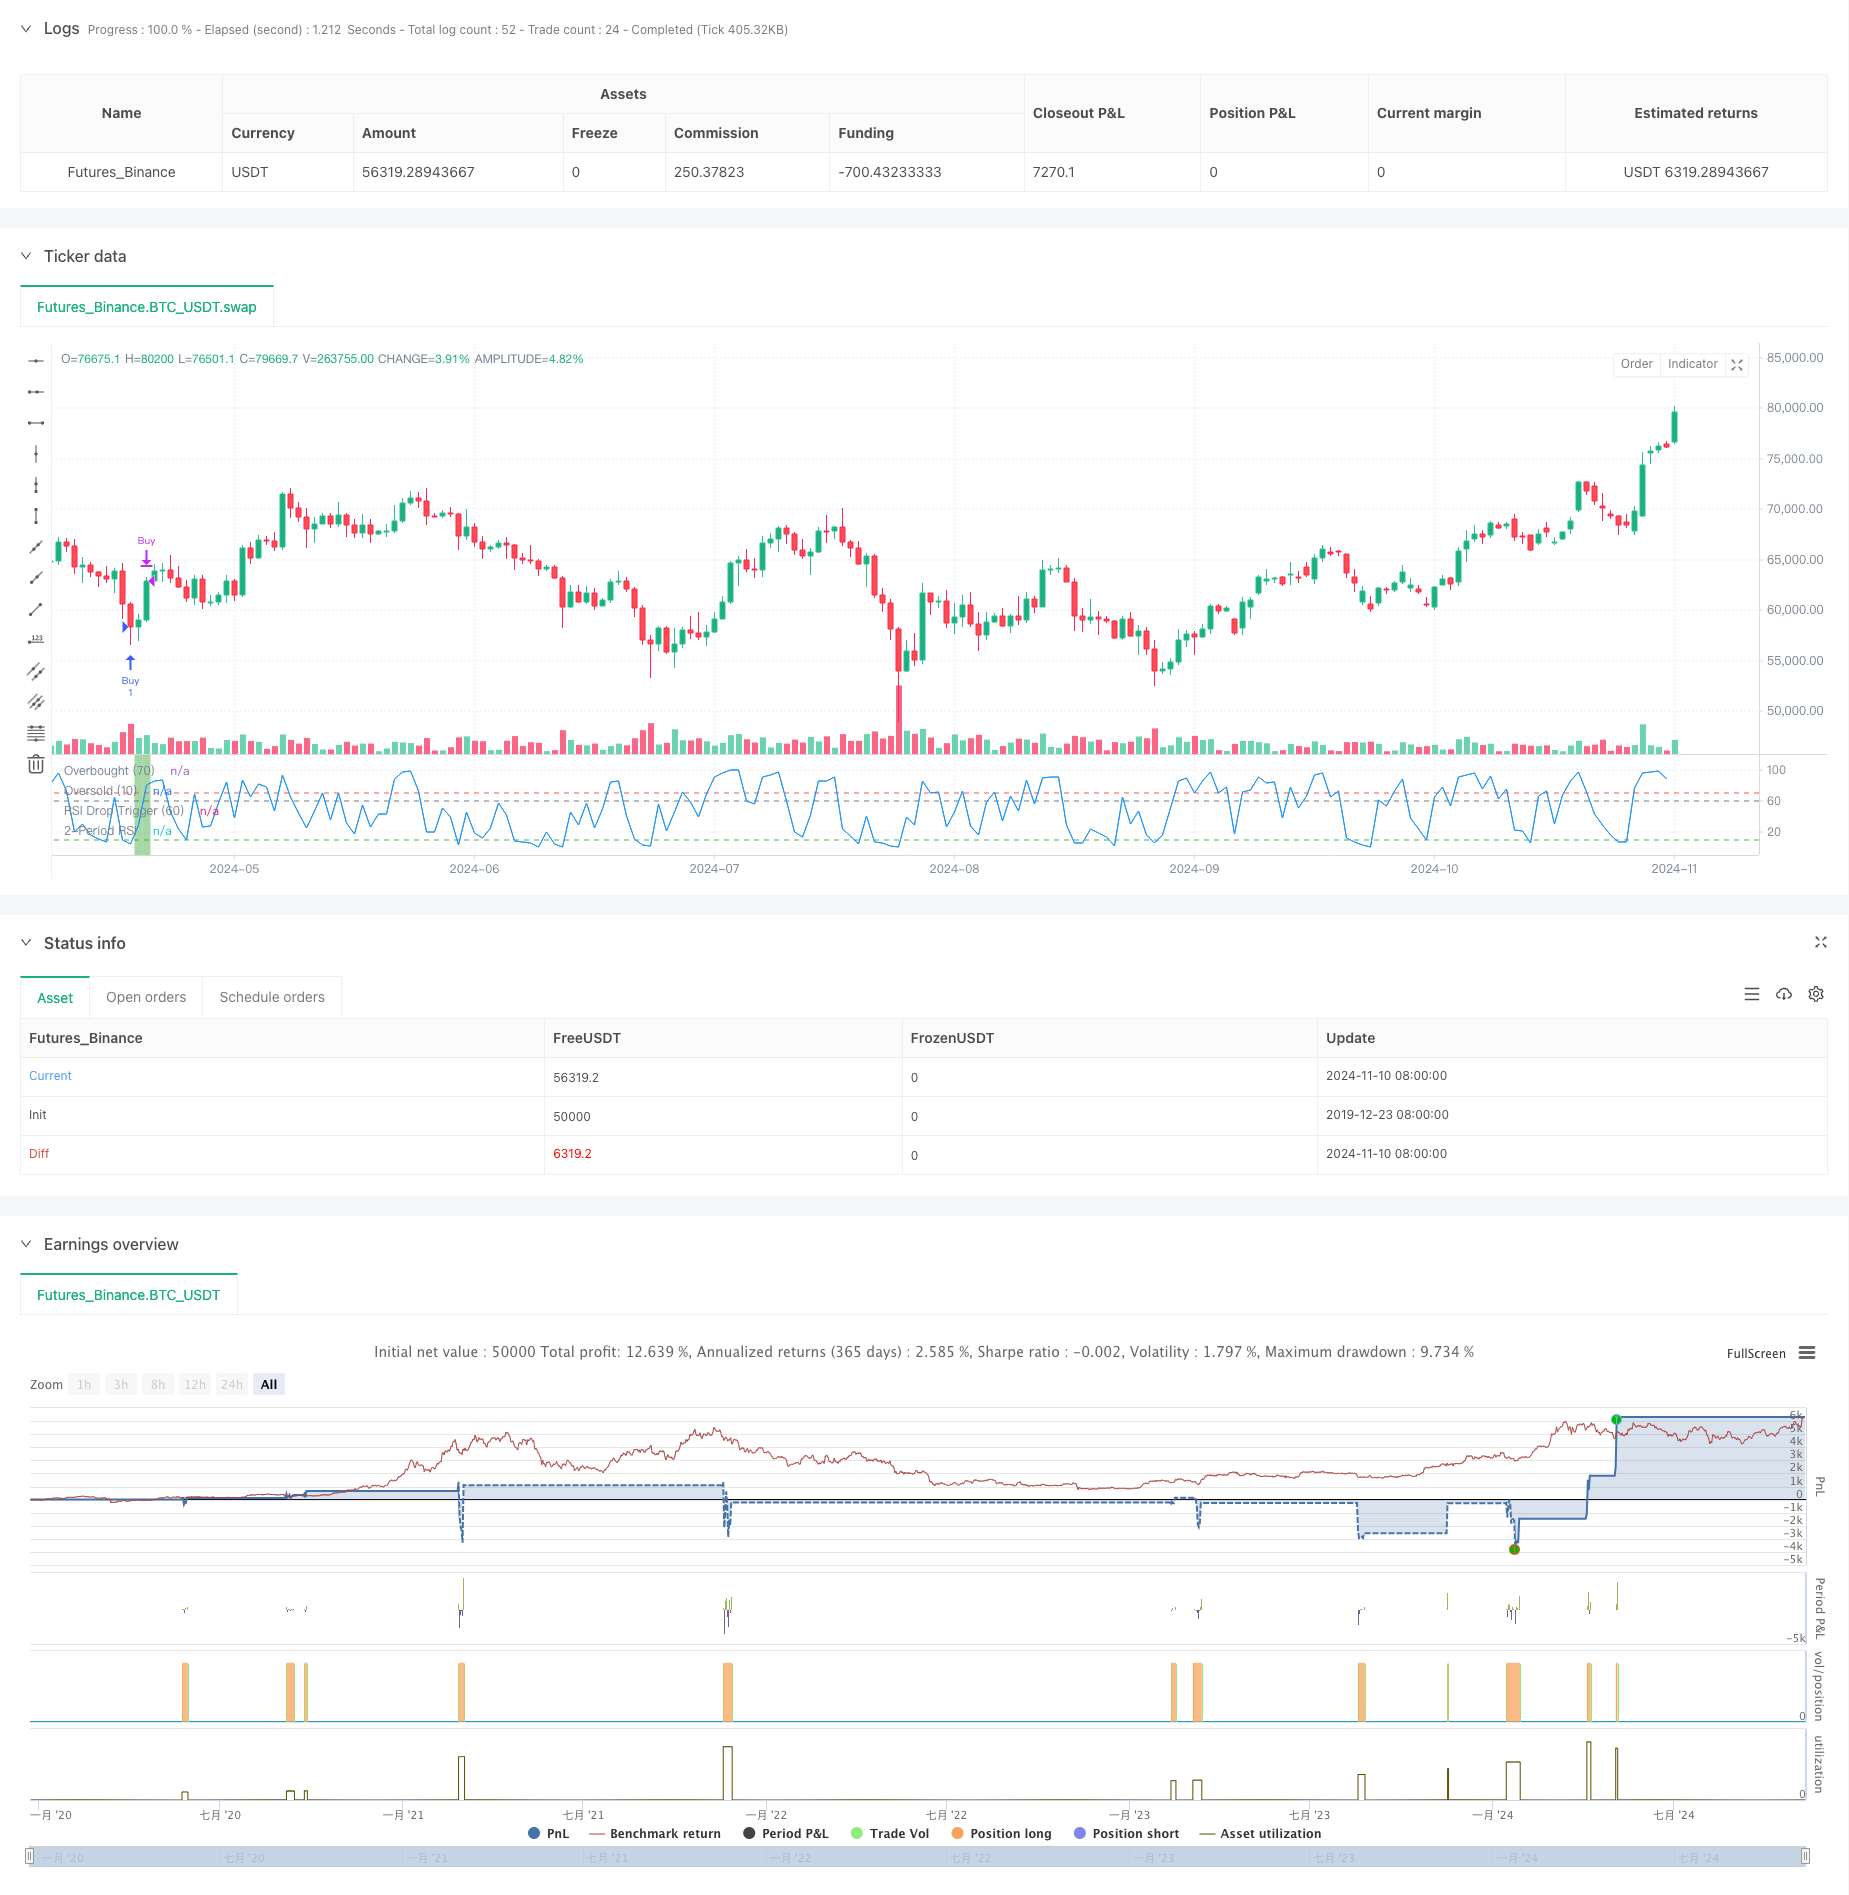
이 전략은 평균 회귀 이론에 기반한 단기 거래 전략으로, 200일 평균선과 2주기 RSI 지표를 결합하여 거래한다. 전략의 핵심은 장기 상승 추세에서 과매매 수정 기회를 찾는 것이며, 트리플 검증 메커니즘을 통해 거래 신호의 신뢰성을 보장한다.
전략 원칙
전략은 트레이드 신호를 확인하기 위해 삼중 검증 메커니즘을 사용합니다. 첫째는 가격이 200 일 평균선 위에 있어야하며, 장기적인 상승 추세를 확인합니다. 둘째는 3 일 연속으로 RSI 하락을 통해 단기 오버셀을 형성하고, 첫 번째 하락은 RSI 60 이상에서 시작해야합니다. 마지막으로 RSI가 10 이하로 떨어지면 극단적인 오버셀이 형성됩니다.
전략적 이점
- 트리플 검증은 거래 신호의 신뢰성을 크게 향상시킵니다.
- 단기 및 장기 지표와 결합하여 단일 지표로 인한 잘못된 신호를 방지합니다.
- 명확한 전략 논리, 간단한 변수 설정, 이해하기 쉽고 실행
- 일률적인 필터링을 통해 거래 방향이 주 트렌드와 일치하는지 확인합니다.
- 극단적인 과매매 조건을 적용하여 거래 성공률을 높여 입장을 촉발합니다.
전략적 위험
- 자주 거래하면 거래 비용이 더 높을 수 있습니다.
- 강세를 보이고 있는 시장에서 지속적인 상승 기회를 놓칠 수 있습니다.
- RSI 지표는 특정 시장 조건에서 지연될 수 있습니다.
- 시장의 급격한 변동으로 인해 너무 많은 가짜 신호가 발생할 수 있습니다. 스톱로스를 설정하고 포지션 보유 시간을 제어하고 거래 주파수를 최적화하여 위험을 관리하는 것이 좋습니다.
전략 최적화 방향
- 추가적인 확인으로 거래량 지표를 추가하는 것을 고려할 수 있습니다.
- RSI 파라미터를 최적화하여 다른 주기의 성능을 테스트합니다.
- 시장 변동에 따라 변수를 조정하는 적응 장치를 도입합니다.
- 트렌드 강도 필터를 추가하여 거래 품질을 향상시킵니다.
- 손해배상 제도를 고려하고, 위험을 통제하는 방법을 최적화한다.
요약하다
이 전략은 평행선과 RSI 지표의 교묘한 조합을 통해 안정적인 거래 시스템을 구축한다. 3번 확인 메커니즘은 거래의 신뢰성을 효과적으로 향상시키지만, 위험 관리 및 변수 최적화에 주의를 기울여야 한다. 전략은 전체적으로 합리적으로 설계되어 있으며, 실용적인 가치와 최적화 공간을 가지고 있다.
전략 소스 코드
/*backtest
start: 2019-12-23 08:00:00
end: 2024-11-11 00:00:00
period: 1d
basePeriod: 1d
exchanges: [{"eid":"Futures_Binance","currency":"BTC_USDT"}]
*/

//@version=5
strategy("Larry Connors RSI 3 Strategy", overlay=false)

// Define the moving averages and the RSI
sma200 = ta.sma(close, 200)
rsi2 = ta.rsi(close, 2)

// Conditions for the strategy
condition1 = close > sma200  // Close above the 200-day moving average

// RSI drops three days in a row and the first day’s drop is from above 60
rsi_drop_3_days = rsi2[2] > rsi2[1] and rsi2[1] > rsi2 and rsi2[2] > 60  // The 3-day RSI drop condition
condition2 = rsi_drop_3_days

// The 2-period RSI is below 10 today
condition3 = rsi2 < 10

// Combined buy condition
buyCondition = condition1 and condition2 and condition3

// Sell condition: The 2-period RSI is above 70
sellCondition = rsi2 > 70

// Execute the buy signal when all buy conditions are met
if buyCondition
    strategy.entry("Buy", strategy.long)

// Execute the sell signal when the sell condition is met
if sellCondition
    strategy.close("Buy")

// Plotting the RSI for visual confirmation
plot(rsi2, title="2-Period RSI", color=color.blue)
hline(70, "Overbought (70)", color=color.red)
hline(10, "Oversold (10)", color=color.green)
hline(60, "RSI Drop Trigger (60)", color=color.gray)

// Set background color when a position is open
bgcolor(strategy.opentrades > 0 ? color.new(color.green, 50) : na)