높은 승률 추세 평균 회귀 거래 전략

BB RSI ATR SMA RR SL TP
생성 날짜: 2024-11-12 14:45:46 마지막으로 수정됨: 2024-11-12 14:45:46
복사: 0 클릭수: 744
avatar of ChaoZhang ChaoZhang
1
집중하다
1617
수행원

높은 승률 추세 평균 회귀 거래 전략

개요

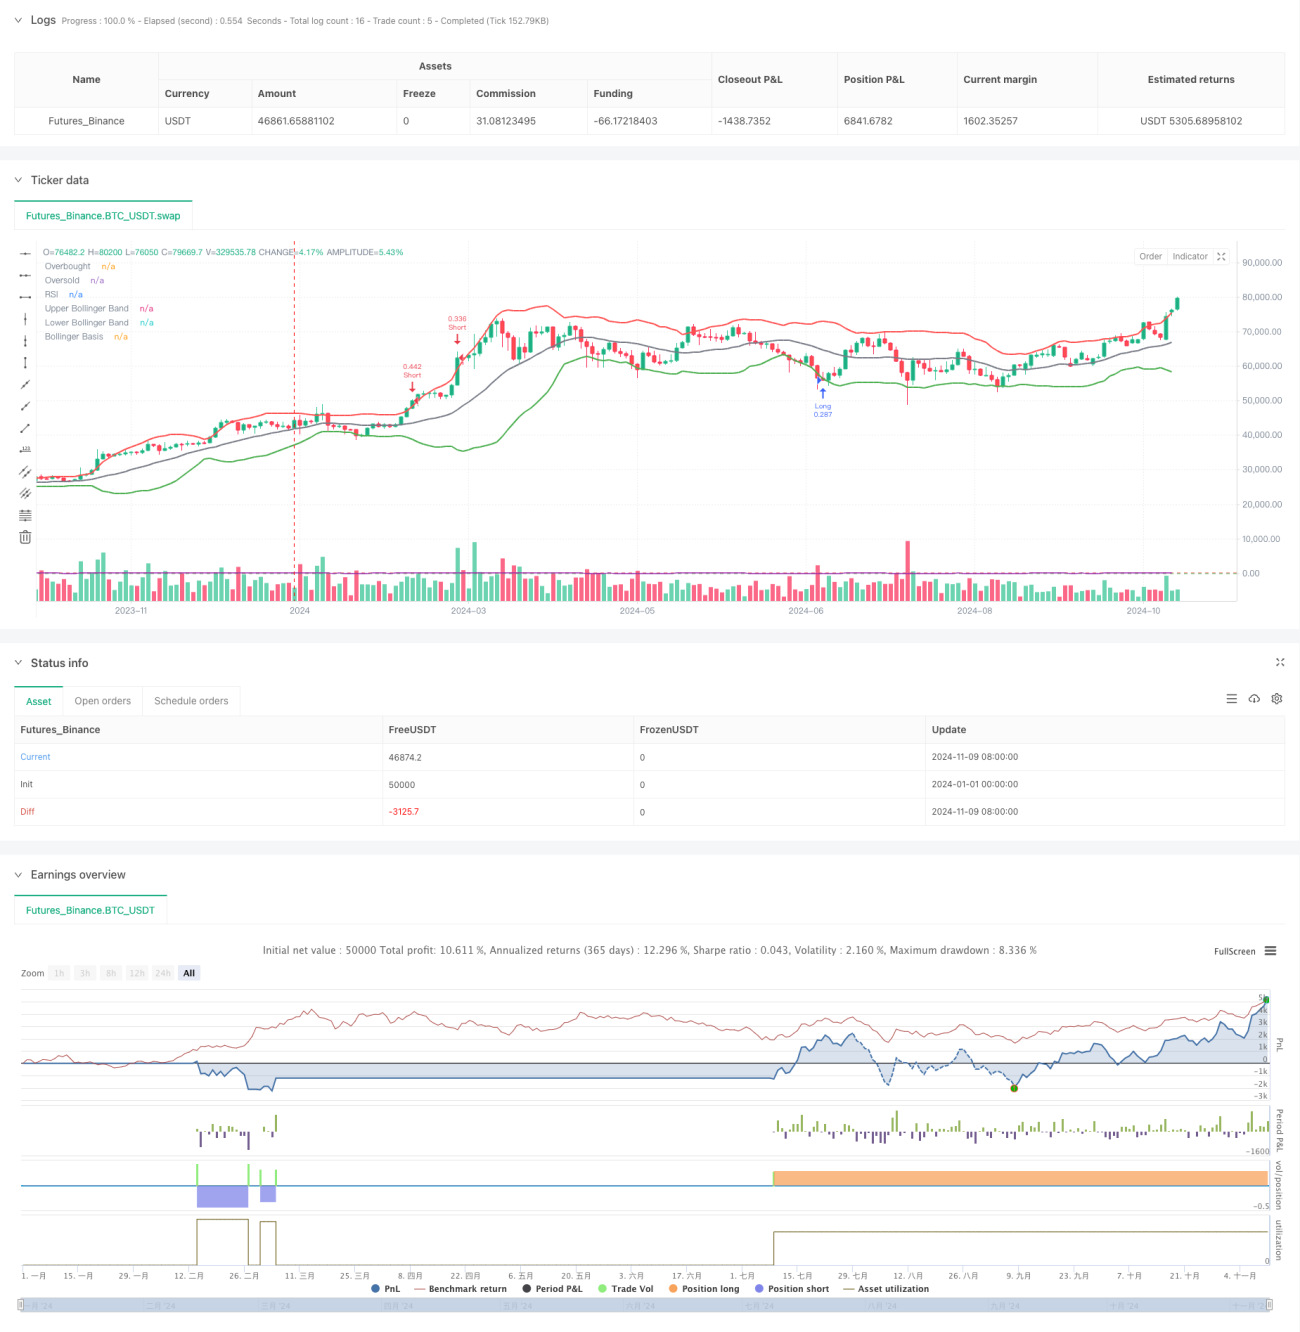
이것은 평균 회귀 원리에 기초하여 설계된 양적 거래 전략이며, 브린 밴드, 상대적으로 강한 지수 ((RSI) 와 평균 실제 파도 ((ATR) 와 같은 기술 지표와 결합하여 시장의 과매매 과매매 상태를 식별하여 거래합니다. 이 전략은 승리률을 높이기 위해 낮은 위험 수익 비율을 설정하고, 자본 관리를 통해 위험을 제어합니다.

전략 원칙

이 전략은 다음과 같은 요소들을 통해 거래가 이루어집니다.

  1. 가격 변동의 범위를 판단하기 위한 브린 대역 ((20일) 을 사용함
  2. RSI (14일) 를 통해 시장의 과매매 상태를 판단합니다.
  3. ATR (14일) 을 사용하여 동적으로 중지 및 수익 목표를 설정합니다.
  4. 부린을 넘어서 RSI가 30보다 낮을 때 더 많이 투자하십시오.
  5. 부린을 뚫고 RSI가 70보다 높을 때 공백을 밟습니다.
  6. 전략의 승률을 높이기 위해 리스크/수익비율을 0.75로 설정합니다.
  7. 계정 이자 기반의 2% 리스크 제어

전략적 이점

  1. 다중 기술 지표와 결합하여 거래 신호의 신뢰성을 향상시킵니다.
  2. 평균 회귀 특성을 통해 시장의 과매매 기회를 잡기
  3. ATR을 사용하여 시장의 변동에 적응하기 위해 스톱 포지션을 동적으로 조정합니다.
  4. 낮은 리스크의 수익률이 세팅보다 전략의 승률을 높여줍니다.
  5. 100% 리스크 관리를 적용하여 자금을 효율적으로 분배합니다.
  6. 전략 논리는 명확하고 이해하기 쉬우며 구현하기 쉽습니다.
  7. 좋은 확장성과 최적화 공간

전략적 위험

  1. 강세를 보이는 시장에서 빈번한 손실이 발생할 수 있습니다.
  2. 낮은 리스크 수익률은 단편적인 수익으로 이어질 수 있습니다.
  3. 부린밴드 및 RSI 지표가 지연될 수 있습니다.
  4. 시장의 급격한 변동이 있을 때, 스톱포지션은 이상적이지 않을 수 있습니다.
  5. 거래 비용은 전략의 전체 수익에 영향을 미칠 수 있습니다. 해결책:
  • 트렌드 필터 추가
  • 입학 시점을 최적화
  • 지표 변수를 조정
  • 더 많은 확인 신호를 도입합니다.

전략 최적화 방향

  1. 트렌드를 판단하는 지표를 도입하여 역동적인 거래를 피하십시오.
  2. RSI와 브린 대역을 최적화하여 신호의 정확성을 향상시킵니다.
  3. 다른 시장 조건에 따라 동적으로 조정된 리스크 수익률
  4. 보조 확인으로 볼륨 표시기 추가
  5. 시간 필터를 추가하여 특정 시간대에 거래하는 것을 피하십시오.
  6. 적응기 변수 메커니즘을 개발하여 전략적 적응력을 향상시킵니다.
  7. 재원 관리 시스템 개선, 지분 규모 최적화

요약하다

이 전략은 평균 회귀 원리와 여러 기술 지표를 결합하여 안정적인 거래 시스템을 구축한다. 낮은 위험 수익률의 설정은 승률을 높이는 데 도움이 되며, 엄격한 위험 관리는 자금 안전을 보장한다. 일부 고유한 위험이 있지만, 지속적인 최적화 및 개선에 의해 전략은 더 나은 성능을 얻을 수 있다.

전략 소스 코드
/*backtest
start: 2024-01-01 00:00:00
end: 2024-11-11 00:00:00
period: 2d
basePeriod: 2d
exchanges: [{"eid":"Futures_Binance","currency":"BTC_USDT"}]
*/

//@version=5
strategy("High Win Rate Mean Reversion Strategy for Gold", overlay=true)

// Input Parameters
bbLength = input.int(20, title="Bollinger Bands Length")
bbMult = input.float(2, title="Bollinger Bands Multiplier")
rsiLength = input.int(14, title="RSI Length")
rsiOverbought = input.int(70, title="RSI Overbought Level")
rsiOversold = input.int(30, title="RSI Oversold Level")
atrLength = input.int(14, title="ATR Length")
rrRatio = input.float(0.75, title="Risk/Reward Ratio", step=0.05)  // Lower RRR to achieve a high win rate
riskPerTrade = input.float(2.0, title="Risk per Trade (%)", step=0.1) / 100  // 2% risk per trade

// Bollinger Bands Calculation
basis = ta.sma(close, bbLength)
dev = bbMult * ta.stdev(close, bbLength)
upperBand = basis + dev
lowerBand = basis - dev

// RSI Calculation
rsi = ta.rsi(close, rsiLength)

// ATR Calculation for Stop Loss
atr = ta.atr(atrLength)

// Entry Conditions: Mean Reversion
longCondition = close < lowerBand and rsi < rsiOversold
shortCondition = close > upperBand and rsi > rsiOverbought

// Stop Loss and Take Profit based on ATR
longStopLoss = close - atr * 1.0  // 1x ATR stop loss for long trades
shortStopLoss = close + atr * 1.0  // 1x ATR stop loss for short trades

longTakeProfit = close + (close - longStopLoss) * rrRatio  // 0.75x ATR take profit
shortTakeProfit = close - (shortStopLoss - close) * rrRatio  // 0.75x ATR take profit

// Calculate position size based on risk
equity = strategy.equity
riskAmount = equity * riskPerTrade
qtyLong = riskAmount / (close - longStopLoss)
qtyShort = riskAmount / (shortStopLoss - close)

// Long Trade
if (longCondition)
    strategy.entry("Long", strategy.long, qty=qtyLong)
    strategy.exit("Take Profit/Stop Loss", from_entry="Long", limit=longTakeProfit, stop=longStopLoss)

// Short Trade
if (shortCondition)
    strategy.entry("Short", strategy.short, qty=qtyShort)
    strategy.exit("Take Profit/Stop Loss", from_entry="Short", limit=shortTakeProfit, stop=shortStopLoss)

// Plot Bollinger Bands
plot(upperBand, color=color.red, linewidth=2, title="Upper Bollinger Band")
plot(lowerBand, color=color.green, linewidth=2, title="Lower Bollinger Band")
plot(basis, color=color.gray, linewidth=2, title="Bollinger Basis")

// Plot RSI for visual confirmation
hline(rsiOverbought, "Overbought", color=color.red)
hline(rsiOversold, "Oversold", color=color.green)
plot(rsi, color=color.purple, title="RSI")