다중 기간 RSI 모멘텀 및 트리플 EMA 추세 추종 복합 전략

RSI EMA
생성 날짜: 2024-11-12 15:07:54 마지막으로 수정됨: 2024-11-12 15:07:54
복사: 0 클릭수: 521
avatar of ChaoZhang ChaoZhang
1
집중하다
1617
수행원

다중 기간 RSI 모멘텀 및 트리플 EMA 추세 추종 복합 전략

개요

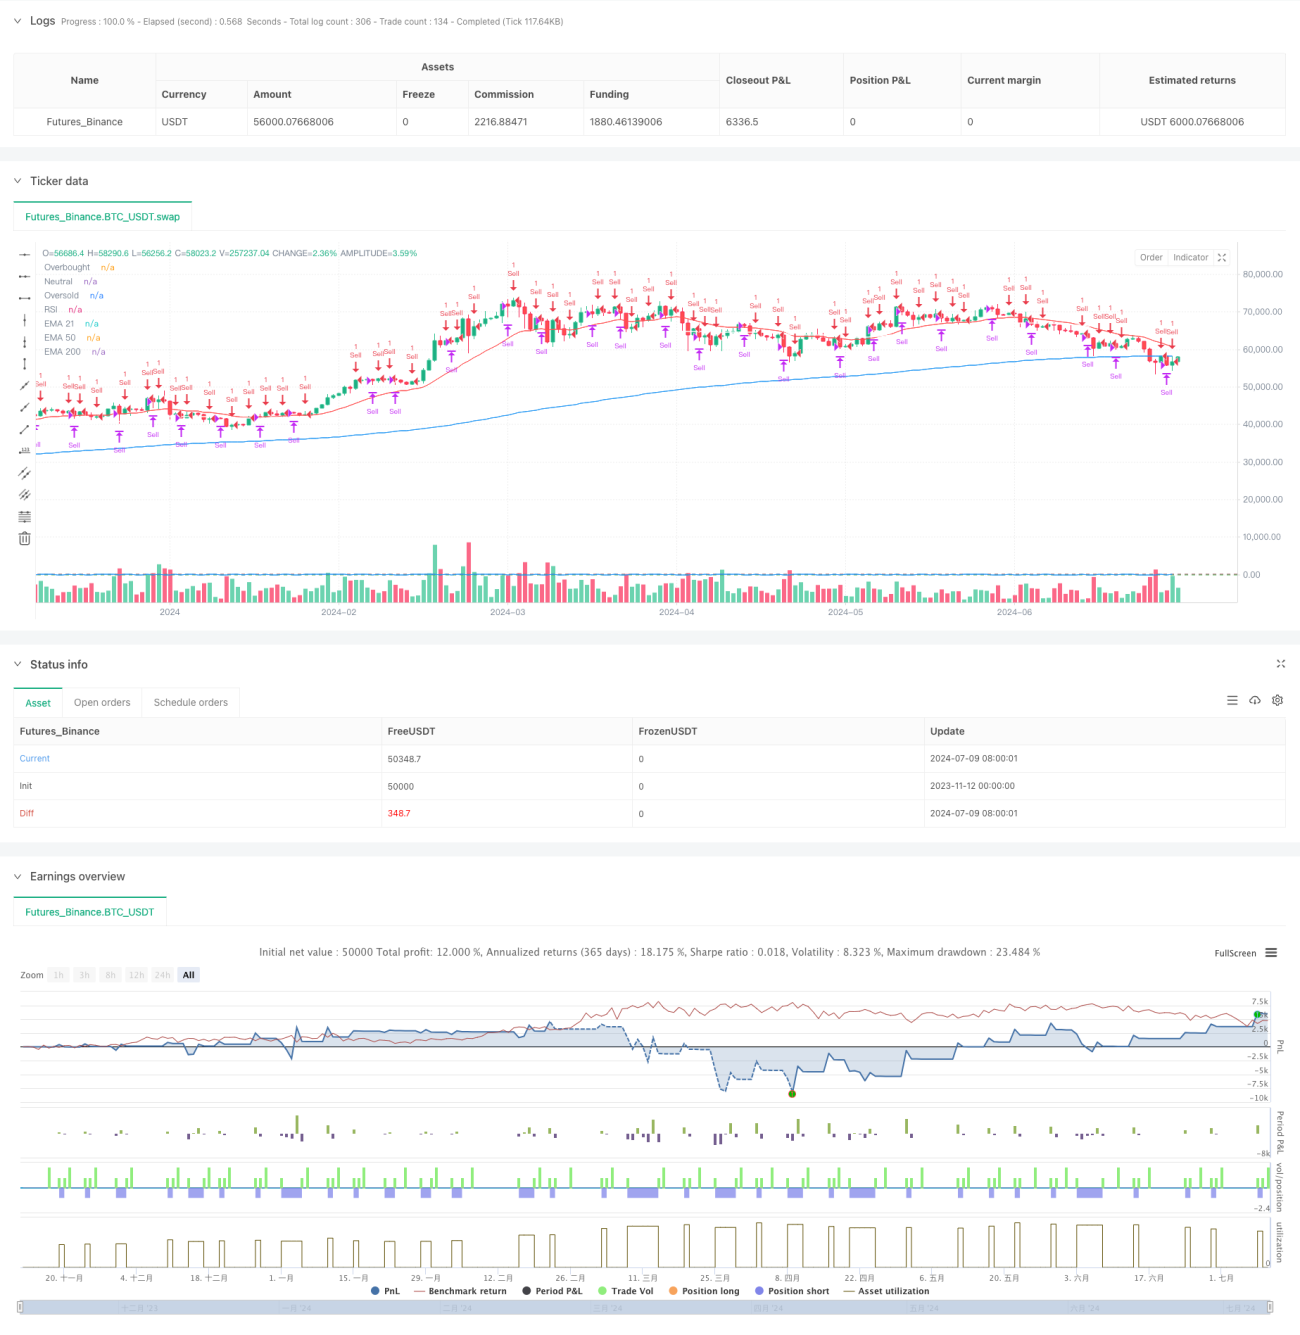
이 전략은 동력 지표 RSI와 트렌드 지표 EMA를 결합한 복합형 거래 시스템이다. 1분과 5분 두 개의 시간 주기에서 작동하며, RSI의 오버 바이 오버 셀 신호와 트리플 EMA의 트렌드 판단을 통해 거래 결정을 내린다. 전략은 트렌드 추적과 평균 회귀를 모두 포함하는 특징을 포함하며, 다양한 시장 환경에서 거래 기회를 잡을 수 있다.

전략 원칙

이 전략은 21/50/200일 트리플 EMA를 트렌드 판단 기준으로 사용하고 있으며, 개선된 RSI 지표 (Chebyshev 방법을 사용하여 계산) 와 결합하여 시장의 과매매 과매매 상태를 식별합니다. 1분 주기에서 RSI가 94을 돌파 할 때 적자를 열고, 4시 평점 포지션을 넘어섰고, RSI가 50으로 돌아왔을 때 보금자리를 설정합니다. 5분 주기에서 가격이 200일 EMA를 넘어 반발 할 때 더 많은 것을 열고, RSI가 과매 또는 하락 할 때 평점 포지션을 설정합니다.

전략적 이점

  1. 다중 시간 주기의 분석은 신호 신뢰성을 향상시킵니다.
  2. 트렌드와 동력 지표의 결합으로 상호 보완적 장점
  3. 보너스 스포드 메커니즘, 위험 제어
  4. 개선된 RSI 계산 방법을 사용하여 신호가 더 정확합니다.
  5. 포지션 관리를 통해 반복 거래를 피하십시오.
  6. 다양한 시장 환경에 적응할 수 있습니다.

전략적 위험

  1. 거래 빈도가 높은 경우 수수료가 더 높을 수 있습니다.
  2. 급격한 변동성 시장에서 자주 스톱 손실을 유발할 수 있습니다
  3. RSI 지표는 특정 시장 조건에서 잘못된 신호를 줄 수 있습니다.
  4. 다주기 전략은 신호 확인에 지연될 수 있다.
  5. EMA 교차 신호는 흔들리는 시장에서 오해를 일으킬 수 있습니다.

전략 최적화 방향

  1. 파동율 필터를 도입하여 높은 파동 동안 매개 변수를 조정합니다.
  2. 거래량 확인 메커니즘
  3. RSI 절벽을 최적화하여 동적 조정을 고려할 수 있습니다
  4. 더 많은 기술 지표를 추가하여 상호 검증
  5. 적응형 매개변수 메커니즘 소개
  6. 더 정교한 손해 방지 장치 개발

요약하다

이 전략은 여러 가지 기술 지표와 여러 시간 주기 분석을 결합하여 거래의 안정성과 신뢰성을 향상시킵니다. 위험이 있지만 합리적인 포지션 관리 및 스톱 손실 메커니즘을 통해 위험을 효과적으로 제어 할 수 있습니다. 전략의 최적화 공간은 넓고, 더 많은 기술 지표와 최적화 매개 변수를 도입하여 전략의 성능을 더욱 향상시킬 수 있습니다.

전략 소스 코드
/*backtest
start: 2023-11-12 00:00:00
end: 2024-07-10 00:00:00
period: 1d
basePeriod: 1d
exchanges: [{"eid":"Futures_Binance","currency":"BTC_USDT"}]
*/

//@version=5
strategy("Combined RSI Primed and 3 EMA Strategy", overlay=true)

// Input for EMA lengths
emaLength1 = input(21, title="EMA Length 1")
emaLength2 = input(50, title="EMA Length 2")
emaLength3 = input(200, title="EMA Length 3")

// Input for RSI settings
rsiLength = input(14, title="RSI Length")
rsiOverbought = input(94, title="RSI Overbought Level")
rsiNeutral = input(50, title="RSI Neutral Level")
rsiOversold = input(4, title="RSI Oversold Level")

// Calculate EMAs
ema1 = ta.ema(close, emaLength1)
ema2 = ta.ema(close, emaLength2)
ema3 = ta.ema(close, emaLength3)

// Calculate RSI using Chebyshev method from RSI Primed
rsi(source) =>
    up = math.max(ta.change(source), 0)
    down = -math.min(ta.change(source), 0)
    rs = up / down
    rsiValue = down == 0 ? 100 : 100 - (100 / (1 + rs))
    rsiValue

rsiValue = rsi(close)

// Plot EMAs
plot(ema1, color=color.red, title="EMA 21")
plot(ema2, color=color.white, title="EMA 50")
plot(ema3, color=color.blue, title="EMA 200")

// Plot RSI for visual reference
hline(rsiOverbought, "Overbought", color=color.red)
hline(rsiNeutral, "Neutral", color=color.gray)
hline(rsiOversold, "Oversold", color=color.green)
plot(rsiValue, color=color.blue, title="RSI")

// Trading logic with position management
var bool inPositionShort = false
var bool inPositionLong = false

// Trading logic for 1-minute timeframe
if (rsiValue > rsiOverbought and not inPositionShort)
    strategy.entry("Sell", strategy.short)
    inPositionShort := true

if (rsiValue < rsiOversold and inPositionShort)
    strategy.close("Sell")
    inPositionShort := false

if (ta.crossover(rsiValue, rsiNeutral) and inPositionShort)
    strategy.exit("Break Even", "Sell", stop=close)

// Trading logic for 5-minute timeframe
var float lastBearishClose = na

if (close < ema3 and close[1] >= ema3) // Check if the current close is below EMA200
    lastBearishClose := close

if (not na(lastBearishClose) and close > lastBearishClose and not inPositionLong)
    strategy.entry("Buy", strategy.long)
    inPositionLong := true

if (rsiValue > rsiOverbought and inPositionLong)
    strategy.close("Buy")
    inPositionLong := false

if (ta.crossunder(rsiValue, rsiNeutral) and inPositionLong)
    strategy.exit("Break Even", "Buy", stop=close)

lastBearishClose := na // Reset after trade execution