RSI 모멘텀 및 다단계 이익 실현/손절매 기반의 지능형 적응형 거래 시스템

1
Follow
1799
Followers
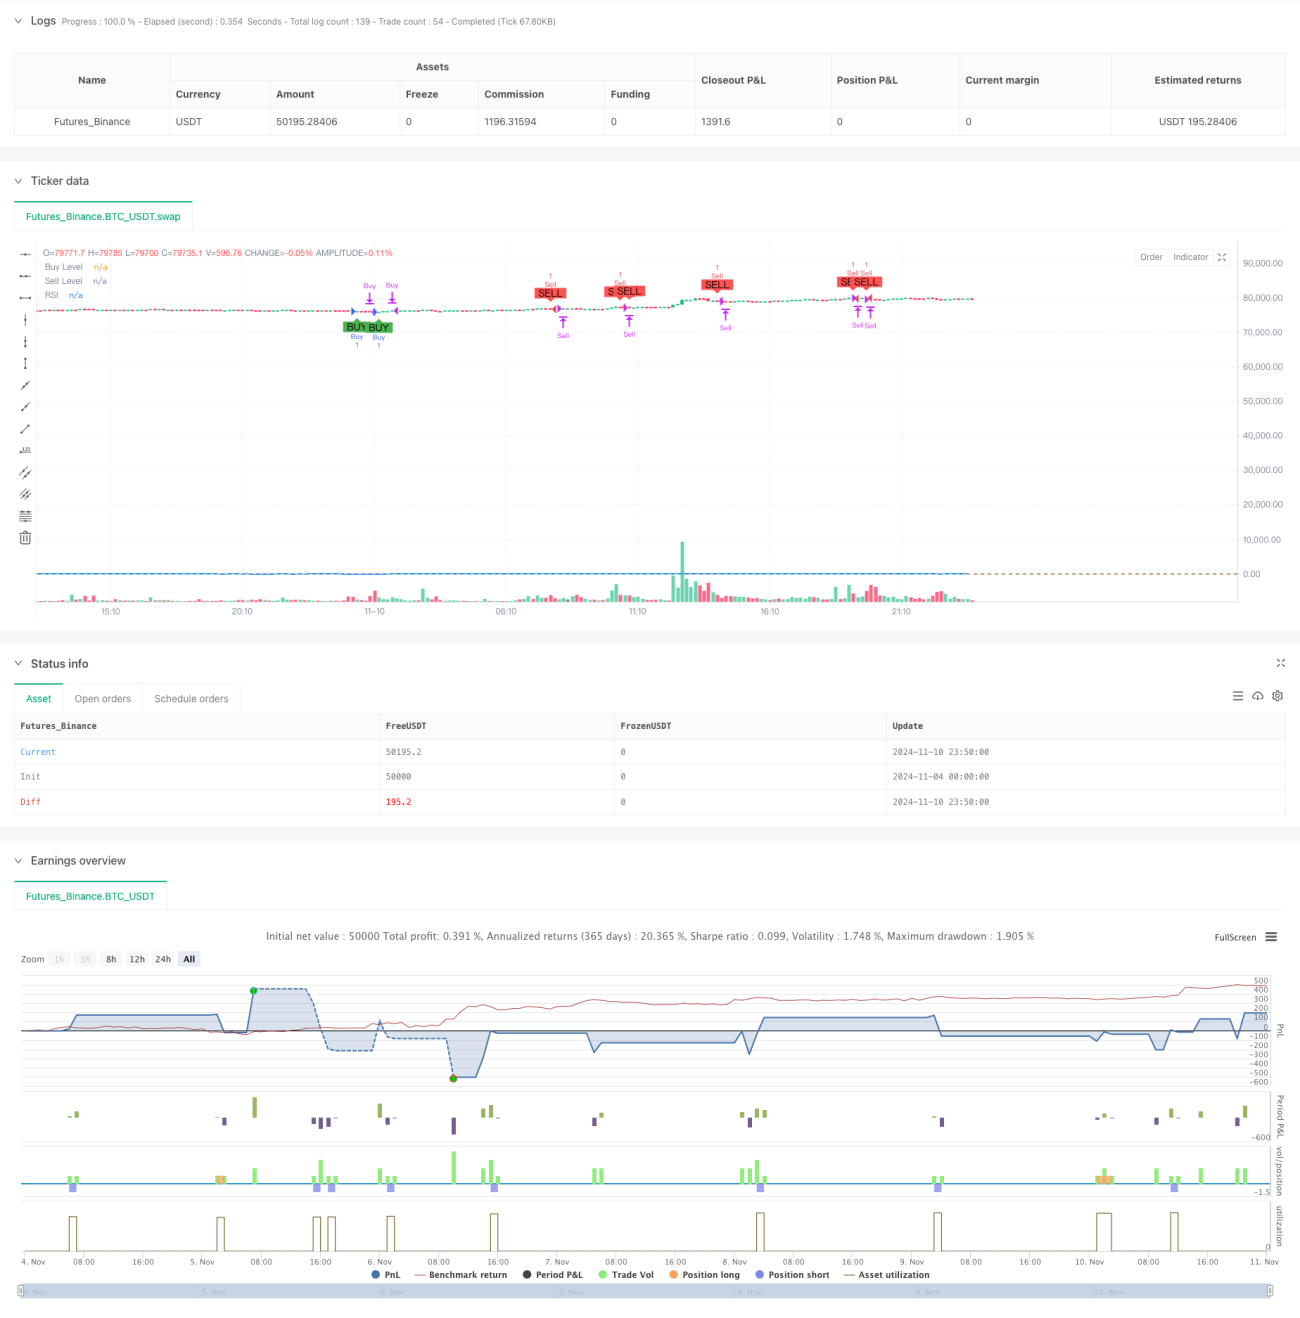
개요
이 전략은 상대강도지수(RSI)를 기반으로 한 적응형 트레이딩 시스템으로, RSI 지표의 과매수/과매도 영역을 모니터링하여 시장 모멘텀 변화를 포착합니다. 시스템은 다단계 이익 실현 및 손절매 제어와 자동 청산 기능을 포함한 지능형 포지션 관리 메커니즘을 통합하여 안정적인 위험-수익 비율을 목표로 합니다.
전략 원리
전략의 핵심은 RSI 지표의 과매수/과매도 신호에 기반하며, 여러 거래 조건을 결합합니다:
- 진입 신호: RSI가 30 수준을 돌파하면 매수 신호가 발생하고, RSI가 70 수준을 하향 돌파하면 매도 신호가 발생합니다.
- 위험 관리:
- 고정 손절매(100포인트 손실) 및 이익 실현 목표(150포인트 이익) 설정
- 포지션 상태를 실시간 추적하여 단방향 포지션 유지
- 매일 15:25에 자동 청산하여 야간 위험 회피
- 거래 실행: 시스템은 strategy.entry 및 strategy.close 함수를 통해 거래 명령을 자동 실행합니다.
전략 장점
- 명확한 신호: RSI 기반 교차 신호가 명확하여 이해 및 실행이 용이합니다.
- 완벽한 위험 관리: 다층적 위험 통제 메커니즘 통합
- 높은 자동화: 신호 생성부터 거래 실행까지 전 과정 자동화
- 우수한 시각화: 차트에 매매 신호와 RSI 수평선을 명확하게 표시
- 높은 적응성: 다양한 시장 특성에 맞게 매개변수 조정 가능
전략 위험
- RSI 신호의 지연 특성으로 인해 진입 시점이 늦어질 수 있습니다.
- 고정된 이익 실현/손절매 포인트가 모든 시장 환경에 적합하지 않을 수 있습니다.
- 단일 지표 의존으로 인해 다른 중요한 시장 신호를 놓칠 수 있습니다.
- 빈번한 거래로 인해 높은 거래 비용이 발생할 수 있습니다.
권장 사항:
- 다른 기술적 지표와 결합하여 신호 확인
- 이익 실현/손절매 수준 동적 조정
- 거래 빈도 제한 추가
전략 최적화 방향
- 지표 최적화:
- 이동평균선 등 추세 지표 추가
- 거래량 지표 추가하여 신호 확인
- 위험 관리 최적화:
- 동적 이익 실현/손절매 구현
- 최대 하락폭 제어 추가
- 실행 최적화:
- 포지션 크기 관리 추가
- 거래 시간 관리 최적화
- 매개변수 최적화:
- 적응형 매개변수 시스템 개발
- 동적 RSI 임계값 구현
요약
이 전략은 RSI 지표를 통해 시장 모멘텀 변화를 포착하고, 완벽한 위험 관리 시스템과 결합하여 완전 자동화된 거래 시스템을 구현합니다. 일부 한계가 있지만, 제안된 최적화 방향을 통해 개선하면 더욱 안정적인 거래 성과를 기대할 수 있습니다. 전략의 핵심 장점은 시스템의 완전성과 자동화 수준에 있으며, 추가 개발 및 최적화를 위한 기본 프레임워크로 적합합니다.
Source
Pine
Related strategies
Comment
All comments (0)
No data
- 1