개요
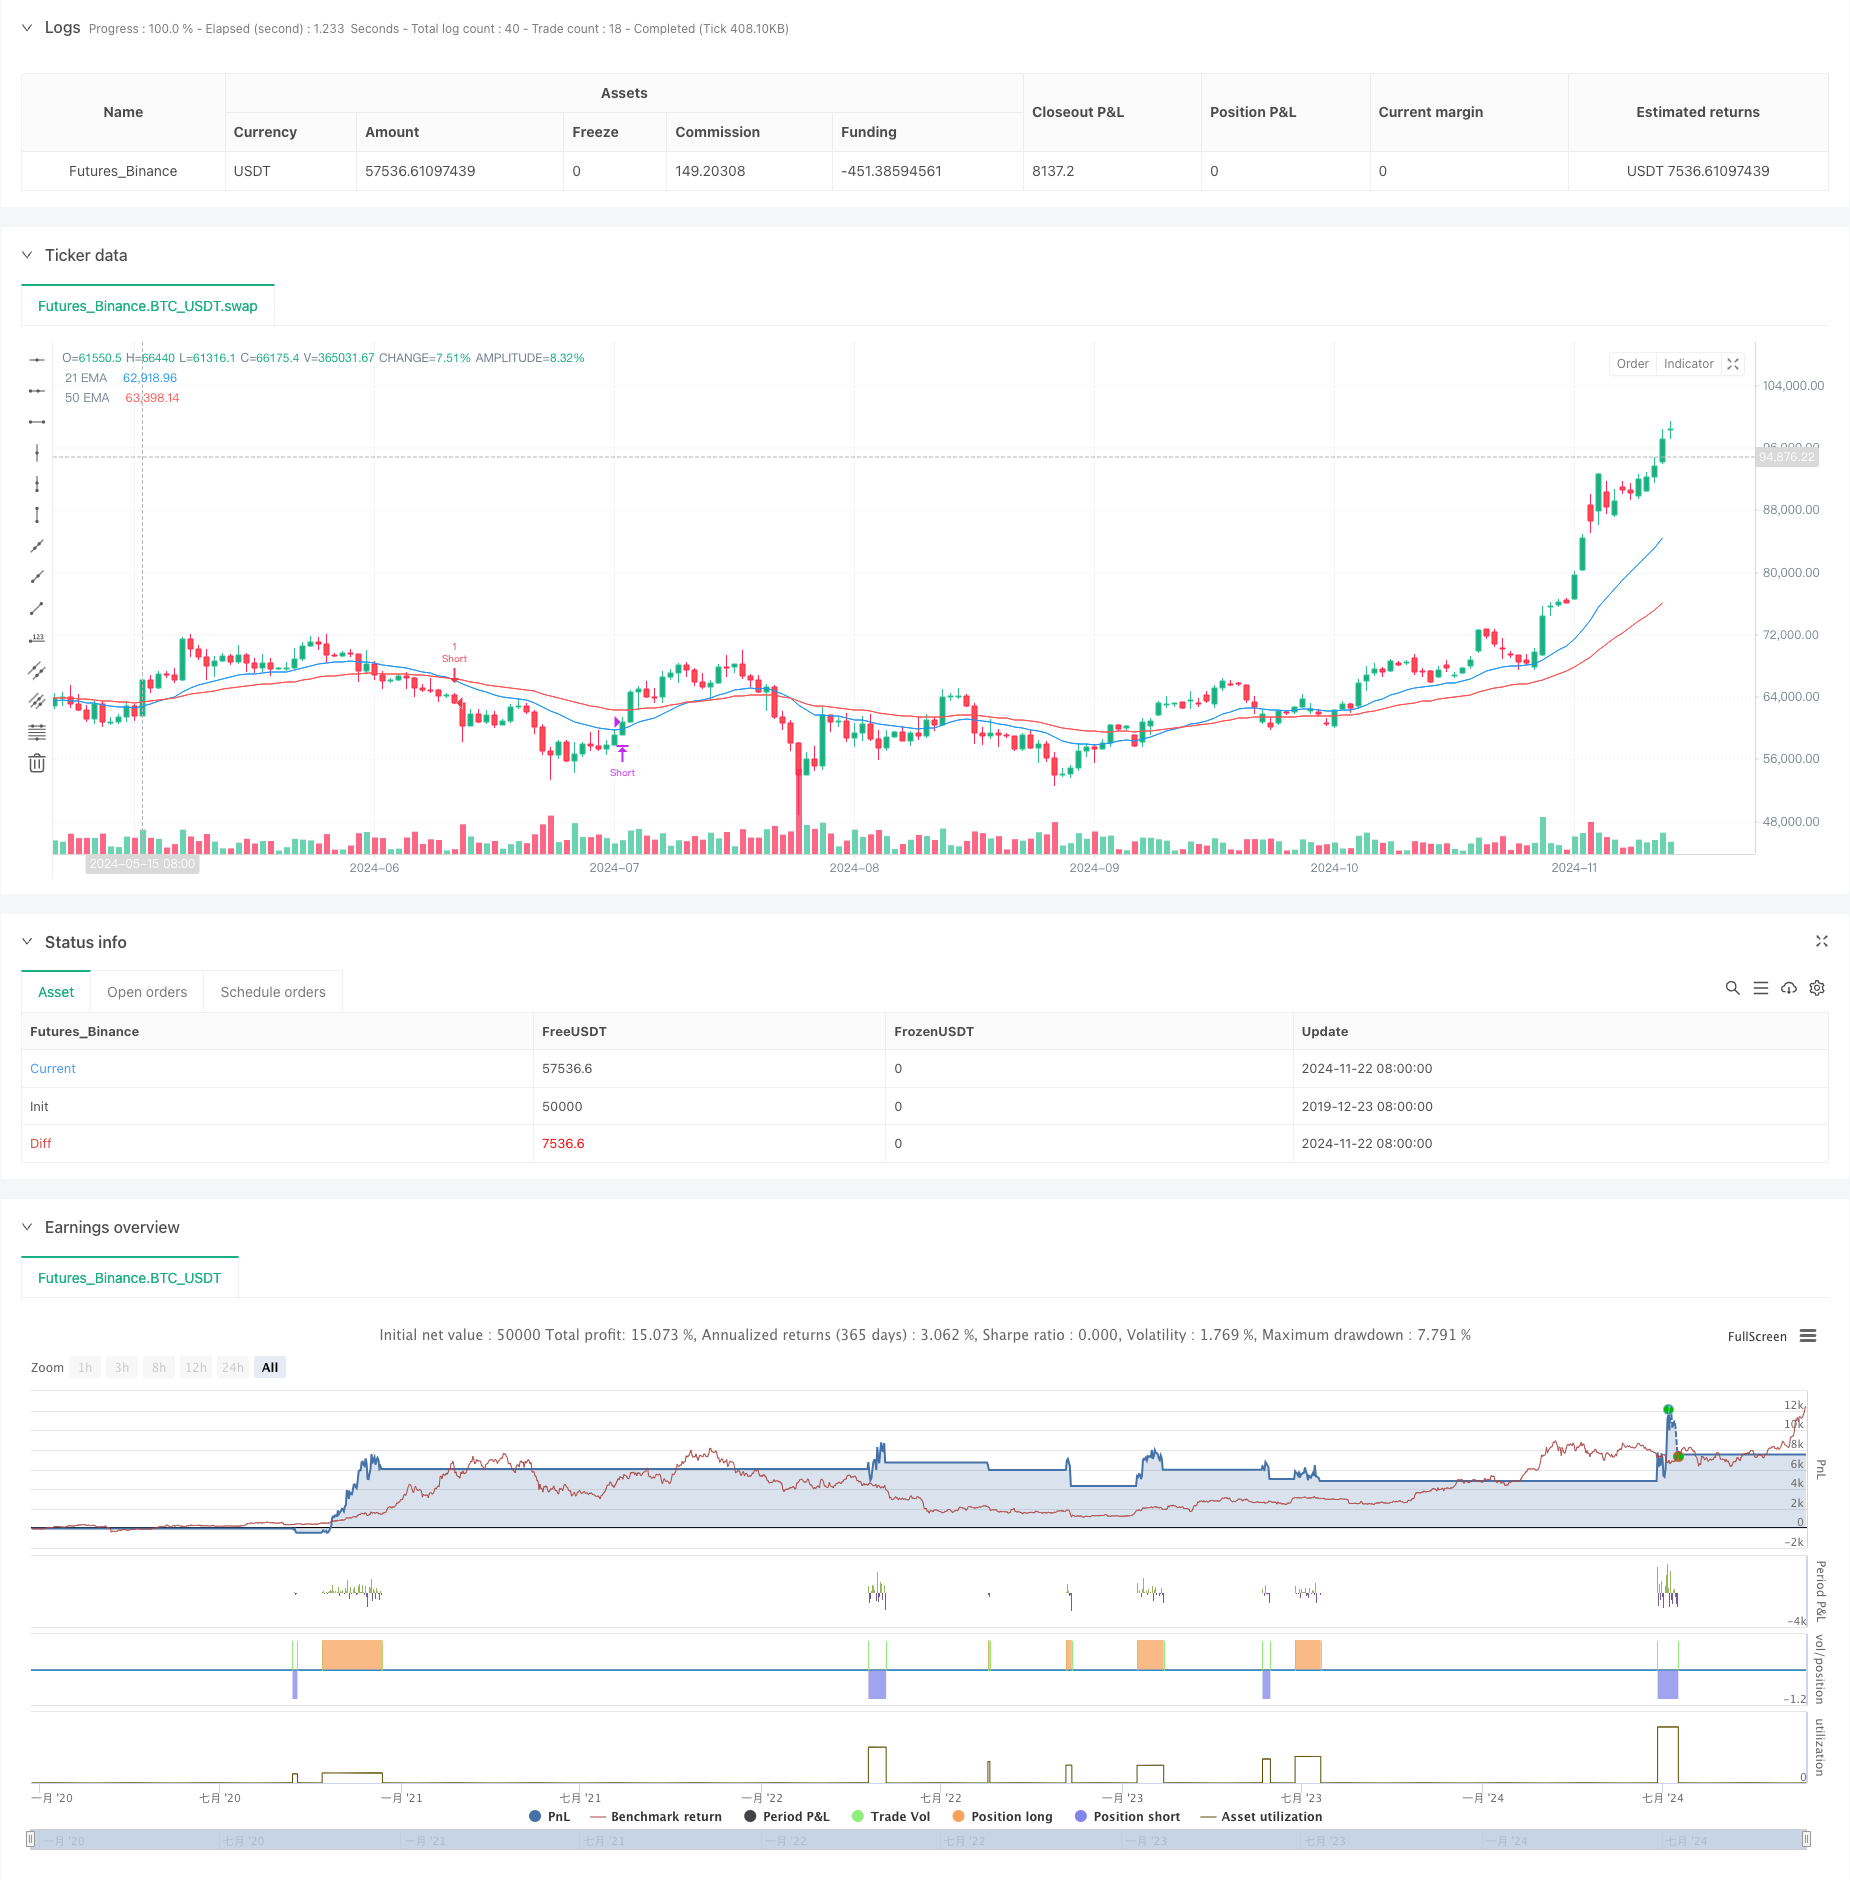
이 전략은 21주기 및 50주기 지수 이동 평균 (EMA) 의 교차 신호를 사용하여 교류 분석을 결합하여 트렌드 방향을 확인하여 시장의 추세를 파악하고 거래 기회를 잡을 수 있습니다. 이 전략은 1시간 시간 주기를 사용하여 기술 지표의 조합을 통해 거래의 정확성과 신뢰성을 향상시킵니다.
전략 원칙
전략의 핵심 논리는 세 가지 주요 부분으로 이루어져 있다: 트렌드 판단, 입문 신호 및 외출 신호. 트렌드 판단은 현재 거래량과 20주기 거래량 평균선을 비교함으로써 이루어진다. 평균선보다 높은 것은 보잉 트렌드, 평균선보다 낮은 것은 보잉 트렌드로 간주된다. 입문 신호는 21주기 EMA와 50주기 EMA의 교차를 기반으로 하고, 합성 거래량 트렌드 확인이 된다.
전략적 이점
- 다중 신호 확인: 평선 교차와 교차량 분석을 결합하여 신호의 신뢰성을 향상시킵니다.
- 트렌드 추적: 양평선 시스템을 사용하여 시장의 흐름을 효과적으로 파악합니다.
- 위험 관리: 명확한 출전 조건을 설정하여 적시에 손실을 막을 수 있습니다.
- 객관적 수치화: 주관적인 판단을 피하고 기술적인 지표에 전적으로 기반한 전략
- 강력한 적응성: 다양한 시장 및 기간에 적용 가능
전략적 위험
- 위기 시장 위험: 위기 시장에서 빈번한 가짜 브레이크가 발생할 수 있습니다.
- 슬라이드 포인트 위험: 높은 주파수 거래가 큰 슬라이드 포인트에 직면할 수 있습니다.
- 자금 관리 위험: 특정 포지션 제어 장치가 설정되지 않았습니다
- 시장 환경 의존성: 전략 성능은 시장 추세 강도에 영향을 많이 받습니다.
전략 최적화 방향
- 트렌드 강도 필터를 추가: ADX와 같은 트렌드 강도 지표를 도입할 수 있습니다.
- 자금 관리를 개선: 동적 포지션 관리 메커니즘을 추가
- 출전 메커니즘을 최적화: 이동 상쇄를 고려할 수 있다
- 회수 컨트롤을 추가: 최대 회수 제한을 설정
- 최적화 변수 선택: 각 주기 변수에 대한 재측정 최적화
요약하다
이 전략은 양평선 시스템과 거래량 분석을 결합하여 전체적인 트렌드 추적 거래 시스템을 구축한다. 전략 설계는 합리적이며, 더 나은 동작성과 적응성을 갖는다. 제안된 최적화 방향에 의해 전략의 안정성과 수익성을 더욱 향상시킬 수 있다. 전략은 트렌드가 명백한 시장 환경에서 사용하기에 적합하지만 투자자가 위험 제어 및 시장 적응성 분석에 주의를 기울여야 한다.
전략 소스 코드
/*backtest
start: 2019-12-23 08:00:00
end: 2024-11-23 08:00:00
period: 1d
basePeriod: 1d
exchanges: [{"eid":"Futures_Binance","currency":"BTC_USDT"}]
*/

//@version=5
strategy("TATA Swing Trading Strategy with Volume and EMAs", overlay=true)

// Define the moving averages
ema21 = ta.ema(close, 21)
ema50 = ta.ema(close, 50)

// Calculate volume moving average for analysis
volumeMA = ta.sma(volume, 20)

// Trend Confirmation using Volume
isBullishTrend = volume > volumeMA
isBearishTrend = volume < volumeMA

// Long Entry Conditions
longCondition = isBullishTrend and ta.crossover(ema21, ema50)
// Short Entry Conditions
shortCondition = isBearishTrend and ta.crossunder(ema21, ema50)

// Exit Conditions
exitLong = close < ema21 or close < ema50
exitShort = close > ema21 or close > ema50

// Execute trades based on conditions
if (longCondition)
    strategy.entry("Long", strategy.long)

if (shortCondition)
    strategy.entry("Short", strategy.short)

if (exitLong)
    strategy.close("Long")

if (exitShort)
    strategy.close("Short")

// Plotting the EMAs
plot(ema21, color=color.blue, title="21 EMA")
plot(ema50, color=color.red, title="50 EMA")