
1
Follow
1802
Followers
개요
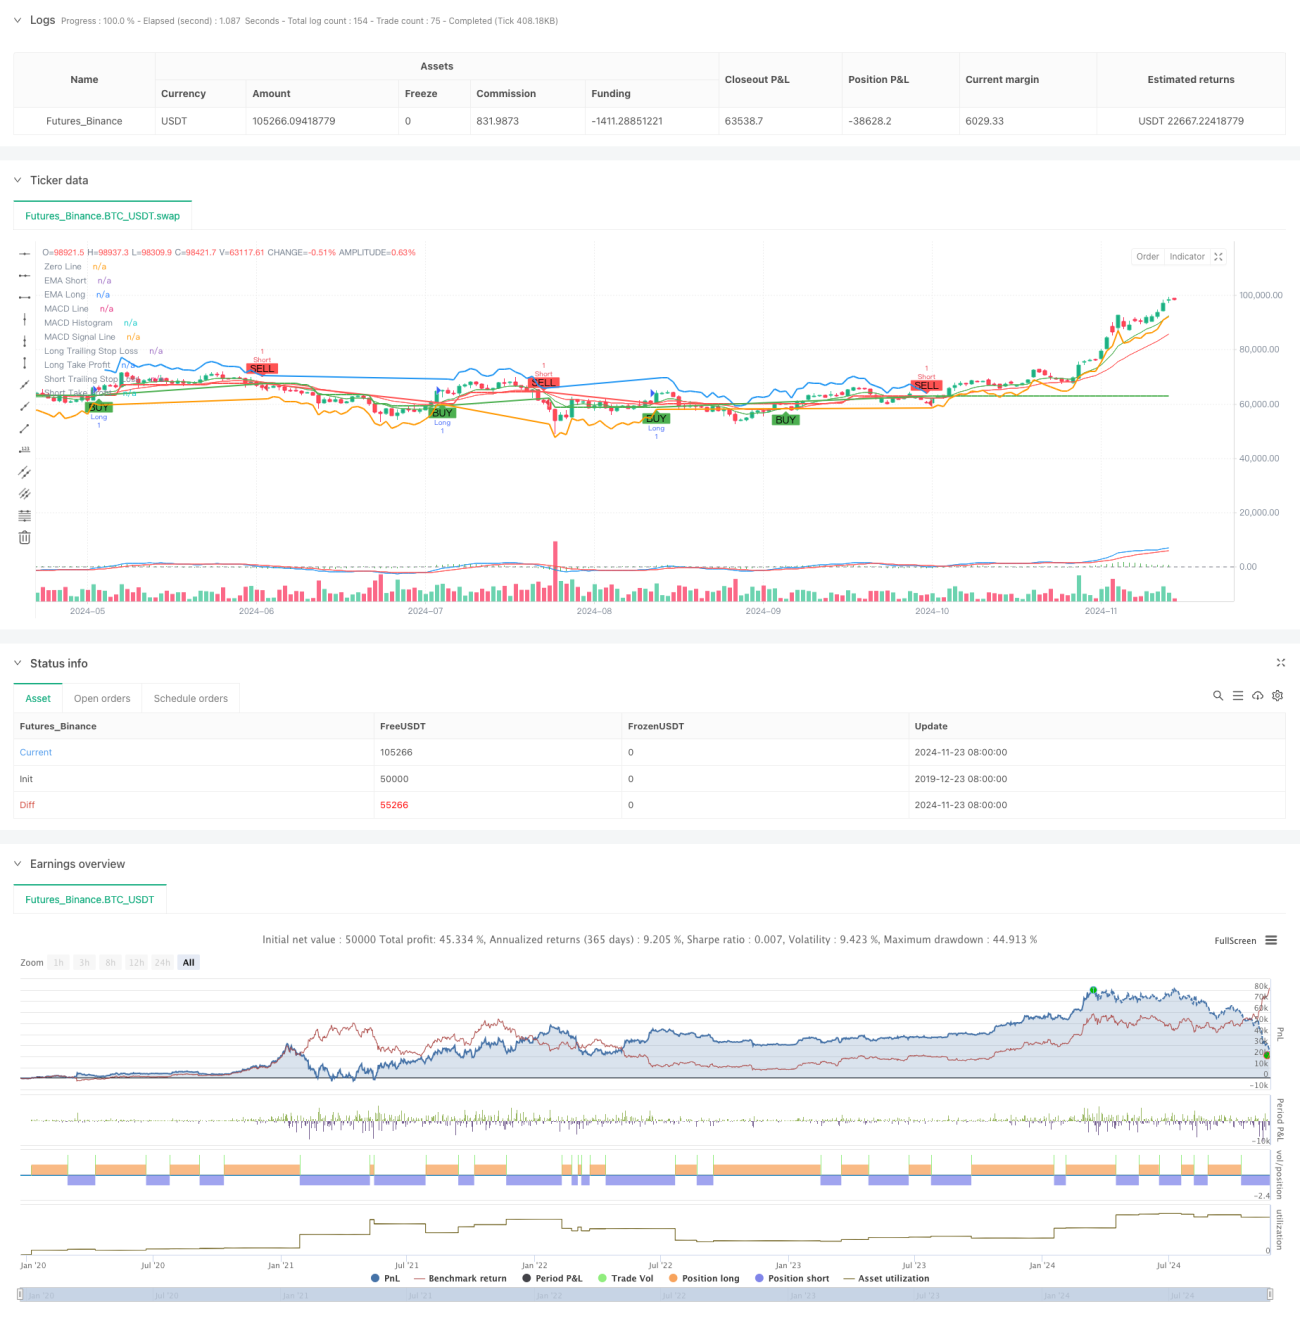
해당 전략은 다중 시간 프레임 분석, 이동평균선 시스템, 모멘텀 지표 및 변동성 지표를 결합한 종합적인 추세 추종 거래 시스템입니다. 시스템은 단기 및 장기 지수이동평균(EMA)의 교차를 통해 추세 방향을 식별하고, 상대강도지수(RSI)를 사용하여 과매수/과매도 판단을 하며, MACD를 통해 모멘텀을 확인하고, 더 높은 시간 프레임의 EMA를 추세 필터로 활용합니다. 시스템은 ATR 기반의 동적 손절 및 이익 실현 방안을 채택하여 시장 변동성에 따라 적응적으로 조정할 수 있습니다.
전략 원리
전략은 다중 검증 메커니즘을 통해 거래 결정을 내립니다:
- 추세 식별 계층: 9기 및 21기 EMA의 교차를 사용하여 추세 변화 포착
- 모멘텀 확인 계층: MACD 지표(12, 26, 9)의 교차 및 방향을 통해 추세 모멘텀 검증
- 과매수/과매도 필터: RSI(14) 지표를 70/30 수준에서 필터링
- 상위 시간 프레임 확인: 선택적으로 일봉 수준 EMA를 추세 필터로 사용
- 리스크 관리 계층: 1.5배 ATR을 트레일링 스탑으로, 2배 ATR을 이익 목표로 설정
시스템은 여러 조건이 충족된 후에만 포지션을 진입합니다: EMA 교차, RSI가 극단값에 도달하지 않음, MACD 방향이 올바르고 상위 시간 프레임 추세 확인. 청산은 트레일링 스탑과 고정 이익 목표를 결합한 방식을 사용합니다.
전략 장점
- 다중 검증 메커니즘으로 가짜 신호를 현저히 줄임
- 상위 시간 프레임 추세 필터링으로 승률 향상
- 변동성 기반 동적 손절로 적응성 우수
- 완전한 리스크 관리 체계
- 다양한 시장 특성에 맞춰 유연하게 파라미터 조정 가능
- 양방향 거래 지원으로 다양한 시장 환경에 대응 가능
- 지표 조합이 추세와 모멘텀을 모두 고려
전략 위험
- 다중 조건으로 인해 일부 거래 기회를 놓칠 수 있음
- 횡보장에서 잦은 거래 발생 가능
- 파라미터 최적화가 과적합을 초래할 수 있음
- 상위 시간 프레임 확인으로 인해 진입 지연 발생 가능
해결 방안:
- 시장 특성에 따라 파라미터 동적 조정
- 거래 방향 선택의 유연성 증가
- 변동성 필터 메커니즘 도입
- 파라미터 자동 적응 메커니즘 최적화
전략 최적화 방향
- 변동성 필터 메커니즘 도입, 높은 변동성 기간에 포지션 조정
- 파라미터 자동 적응 메커니즘 개발, 시장 상태에 따라 동적 조정
- 거래량 지표 추가하여 신호 유효성 확인
- 상위 시간 프레임 추세 판단 로직 최적화
- 손절 방안 보완, 시간 손절 추가 고려
- 전략 성능 평가 모듈 개발
요약
해당 전략은 여러 기술 지표의 조합과 엄격한 리스크 관리 제도를 통해 추세 시장에서 안정적인 수익을 창출할 수 있는 완전한 추세 추종 거래 시스템입니다. 시스템의 확장성이 뛰어나며, 최적화를 통해 다양한 시장 환경에 적응할 수 있습니다. 실전 거래 전에 충분한 백테스트와 파라미터 최적화를 권장합니다.
Source
Pine
Strategy parameters
Related strategies
Comment
All comments (0)
No data
- 1