
1
Follow
1780
Followers
개요
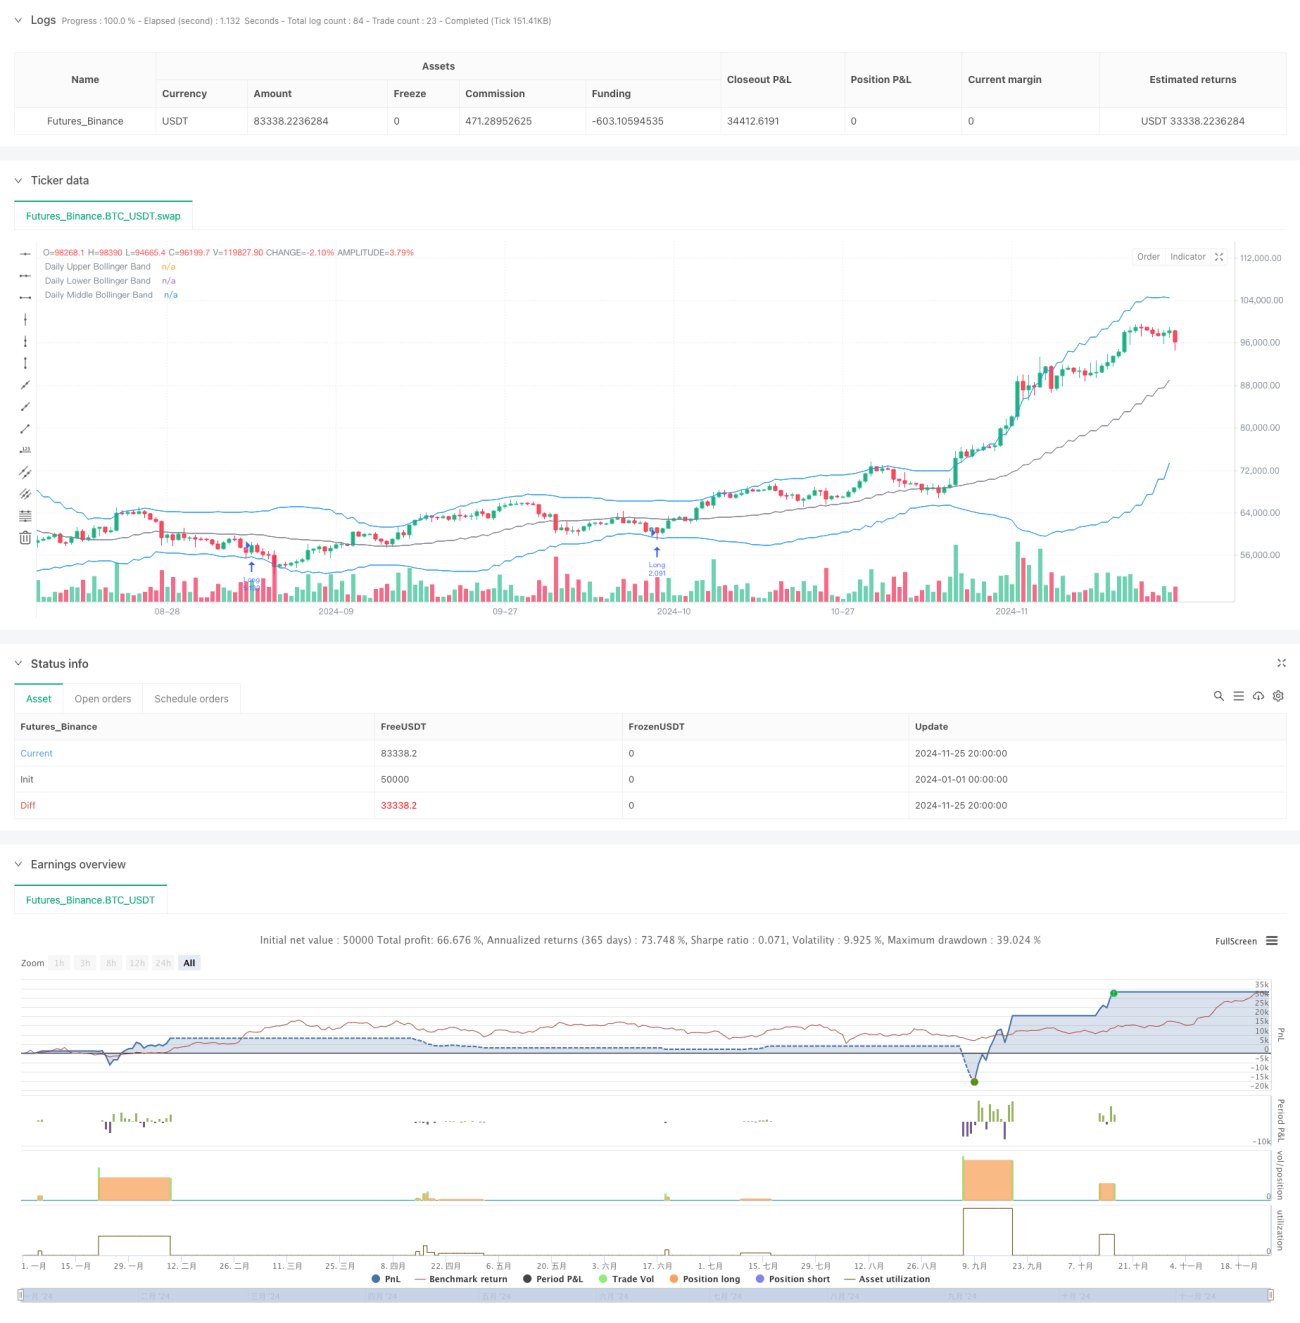
이것은 볼링거 띠와 <unk> 그래프 형태 분석에 기초한 트렌드 추적 전략이다. 전략은 주로 가격이 볼링거 띠를 접촉할 때 <unk> 그래프 형태 특성을 관찰하여 상하 유도선과 실체의 비율 관계와 결합하여 시장의 가능한 역전점을 판단한다. 동시에, 전략은 고정 위험 모델을 사용하여 각 거래의 위험 도로를 제어하고, 여러 시간 주기의 분석을 통해 거래의 정확성을 향상시킨다.
전략 원칙
전략의 핵심 논리는 다음과 같은 몇 가지 핵심 요소에 기반합니다: 첫째, 20 주기의 볼링을 계산하여 가격 변동의 범위를 결정합니다. 둘째, 가격이 볼링대를 만질 때, <unk> 그래프의 위아래 가이드와 실체의 비율을 분석합니다. 비율이 설정된 임계치를 초과하면 잠재적인 역전 신호로 간주합니다. 셋째, 핵심 지원 지점과 저항 지점을 계산하여 중지 지점을 설정합니다. 마지막으로, 계좌 총액의 고정 비율 ((1%) 에 따라 거래 당 포지션을 계산하여 위험을 역동적으로 관리합니다.
전략적 이점
- 리스크 관리가 정확합니다: 고정 비율의 리스크 관리 모델을 사용하여 각 거래의 리스크 <unk>을 제어할 수 있는 범위 내에서 보장합니다.
- 입점 유연성: 다양한 입점 가격 선택으로 다양한 거래 스타일에 적응할 수 있습니다.
- 기술 지표 결합: 볼링 띠와 <unk> 그래프 형태 분석을 결합하여 신호의 신뢰성을 향상시킨다
- 상쇄 손실 설정 합리적인: 핵심 지지 저항 지점을 설정하여 상쇄 손실을 중지하고 시장 작동 법칙에 따라
- 거래 관리가 완벽하다: 주문 만료 메커니즘을 포함하고, 만료 신호로 인한 오작동을 방지한다
전략적 위험
- 시장의 급격한 변동 위험: 급격한 변동 시장에서 리드 비율은 잘못된 신호를 줄 수 있습니다.
- 자금 관리 위험: 고정 비율 위험 모델은 연속적인 손실이 발생할 경우 너무 작은 포지션으로 이어질 수 있습니다.
- 스톱 로즈 설정 위험: 일부 시장 조건에서 지지부진의 계산이 정확하지 않을 수 있습니다.
- 시간 주기 의존성: 전략은 주로 일선 수준에 기반하여, 더 작은 시간 프레임의 기회를 놓칠 수 있다.
전략 최적화 방향
- 거래량 지표 도입: 신호 확인 시 거래량 분석을 추가하여 신호의 신뢰성을 높일 수 있다.
- 최적화된 스톱 메커니즘: 동적 스톱을 도입하여 시장의 변동에 따라 자동으로 스톱 거리를 조정하는 것을 고려하십시오.
- 시장 환경 필터를 추가: 트렌드 강도 지표를 추가하여 다른 시장 환경에 따라 전략 매개 변수를 조정합니다.
- 포지션 관리를 개선: 동적 포지션 관리를 도입하여 시장의 변동성에 따라 리스크 <unk>을 조정하는 것을 고려하십시오.
- 시간 필터 추가: 시장의 큰 변동이있는 시간에 거래를 피하기 위해 시간 필터를 추가할 수 있습니다.
요약하다
이 전략은 고전적인 기술적 분석 도구와 현대적인 위험 관리 방법을 결합하여 비교적 완벽한 거래 시스템을 구축한다. 전략의 핵심 장점은 엄격한 위험 제어와 유연한 입시 메커니즘이지만 실제 응용에서 시장 환경의 변화와 신호의 신뢰성을 검증하는 데 주의를 기울여야 한다. 제안된 최적화 방향에 따라 전략은 더욱 향상될 여지가 있으며, 특히 신호 필터링과 위험 관리의 측면에 있다.
Source
Pine
/*backtest
start: 2024-01-01 00:00:00
end: 2024-11-26 00:00:00
period: 12h
basePeriod: 12h
exchanges: [{"eid":"Futures_Binance","currency":"BTC_USDT"}]
*/

//@version=5
strategy("Trade Entry Detector, based on Wick to Body Ratio when price tests Bollinger Bands", overlay=true, default_qty_type=strategy.fixed)

// Input for primary analysis time frameStrategy parameters
Related strategies
Comment
All comments (0)
No data
- 1