평균 회귀 Bollinger Band RSI 전략과 ATR 동적 손절매 최적화 시스템을 결합

개요
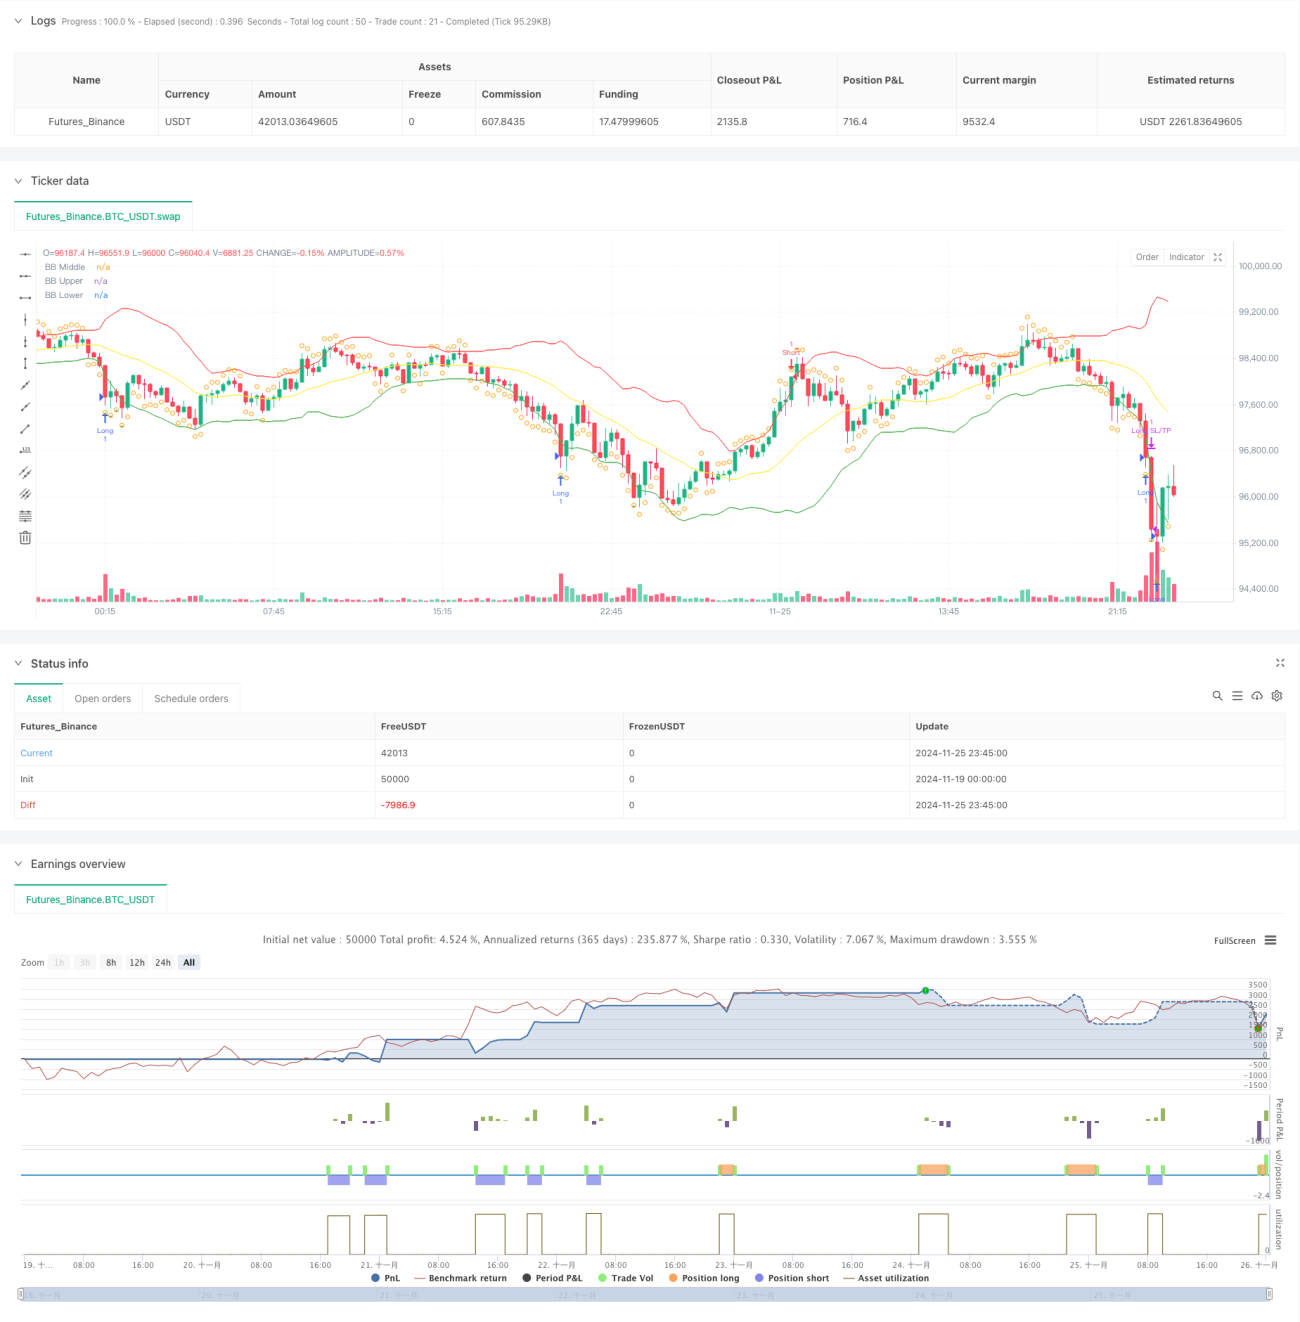
이 전략은 평균 회귀 이론에 기반한 정량 거래 시스템으로, 부린 밴드, RSI 지표와 ATR 동적 손실 메커니즘을 결합한다. 이 전략은 가격의 평균에서 벗어난 극단적인 상황을 식별하여 거래한다. 가격이 부린 밴드 아래로 이동하고 RSI가 초매 지역에있을 때 더 많이 거래하고, 가격이 부린 밴드 위로 이동하고 RSI가 초매 지역에있을 때 공백을 만들고, ATR 동적 위치를 설정하여 손실을 중지하고 수익을 효과적으로 관리한다.
전략 원칙
이 전략은 20주기 브린 띠를 주요 트렌드 판단 지표로 사용하고, 표준 격차 배수는 2.0으로 설정되어 가격 변동의 상하 경계를 결정한다. 동시에 14주기 RSI를 보조 지표로 도입하고, RSI는 30보다 낮으면 과매가 되고, 70보다 높으면 과매가 된다. 가격이 브린 띠의 궤도를 벗어나고 RSI는 30보다 낮으면 시장이 과매할 가능성이 있음을 나타내고, 시스템이 더 많은 신호를 낸다. 가격이 브린 띠의 궤도를 벗어나고 RSI는 70보다 높으면 시장이 넘어갈 가능성이 있음을 나타내고, 시스템이 공백 신호를 낸다. 이 전략은 브린 띠의 궤도를 수익의 종점으로 사용하고, RSI를 역으로 돌파하는 포지션 관리를 한다. 또한, 전략은 14주기 ATR 기반의 동적 스톱 손실 메커니즘을 도입하고, ATR 2배로 손실을 설정하고, ATR 3배로 위험을 중지하여, 보다 정확한 위험 통제를 실현한다.
전략적 이점
- 다중 지표 크로스 검증과 결합: 부린 띠와 RSI의 연동으로 가짜 신호를 효과적으로 필터링하여 거래 정확도를 향상시킵니다.
- 다이내믹 스톱 메커니즘: ATR을 사용하여 스톱 스톱 포지션을 다이내믹으로 조정하여 위험 관리를 시장의 변동에 더 적합하게합니다.
- 완전한 거래 폐쇄 순환: 명확한 입출장 조건과 위험 관리 메커니즘을 포함하고, 논리가 완전하고 명확하다.
- 적응력: 전략의 매개 변수는 시장의 특성에 따라 최적화 조정할 수 있다.
전략적 위험
- 트렌드 시장 위험: 평균 회귀 전략은 강한 트렌드 시장에서 빈번하게 손실될 수 있다.
- 변수 민감성: 브린 밴드 주기, RSI 마이너스 등 변수의 설정이 전략 성능에 큰 영향을 미칩니다.
- 평형상황을 잡기: 중도 평형상황은 유리한 상황에서 조기 퇴출을 초래할 수 있다.
- 스톱 손실: 고정 배수의 ATR 스톱 손실은 급격한 변동이 있을 때 너무 커질 수 있다.
전략 최적화 방향
- 트렌드 필터를 추가하십시오: 더 긴 주기의 이동 평균을 추가하는 것을 고려하여 강한 트렌드 시장에서 역동적인 거래를 피하십시오.
- 거래량 지표 도입: 거래량을 거래 신호의 확인 지표로 사용하여 거래 품질을 향상시킵니다.
- 최적화 중지 메커니즘: 수익성을 높이기 위해 트레일링 스톱이나 분량 중지 방식을 고려할 수 있습니다.
- 동적 조정 파라미터: 시장의 변동률에 따라 부린 밴드 및 RSI의 파라미터 설정을 조정합니다.
요약하다
이 전략은 브린 띠와 RSI의 조합 응용을 통해 완전한 평균 회귀 거래 시스템을 구축한다. ATR 동적 스톱의 도입은 위험을 효과적으로 제어하고, 전략이 좋은 위험 수익 특성을 갖는다. 약간의 최적화 공간이 있지만, 전체적인 설계 개념은 명확하고 실용성이 강하다. 상인은 실내에서 적용할 때 특정 시장 특성에 따라 매개 변수를 조정하고, 전략의 성능을 지속적으로 모니터링하는 것이 좋습니다.
- 1