PVT-EMA 추세 교차 볼륨 가격 전략

1
Follow
1779
Followers
개요
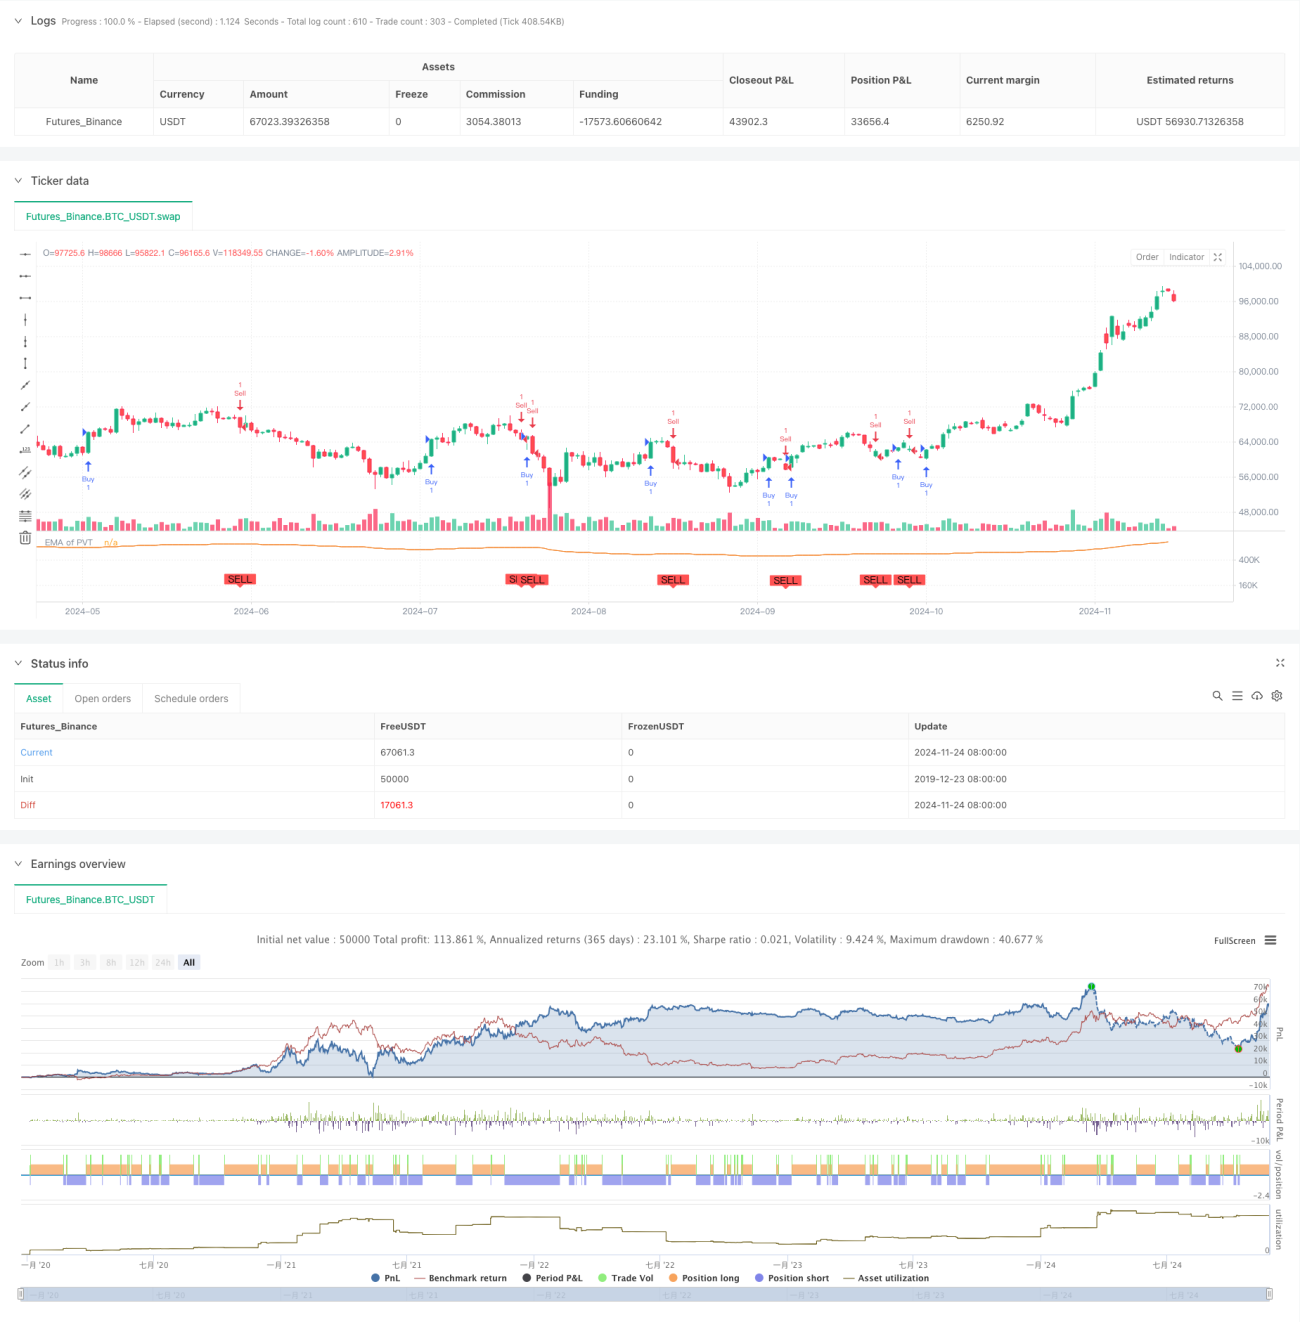
이 전략은 가격대수 트렌드 지표 ((PVT) 와 그 지수 이동 평균 ((EMA) 의 교차를 기반으로 한 트렌드 추적 거래 시스템입니다. 전략은 PVT 지표와 그 EMA의 교차 상황을 모니터링하여 시장 추세의 변화를 식별하여 잠재적인 거래 기회를 잡습니다. 이 방법은 가격 변화와 거래량의 변화를 결합하여 시장의 실제 움직임을 더 정확하게 반영합니다.
전략 원칙
이 전략의 핵심은 PVT 지표를 이용하는 것으로, 이 지표는 가격 변화와 거래량을 결합하여 시장 추세를 추적한다. 구체적으로, 당일 가격 변화의 비율과 당일 거래량의 곱셈으로 PVT 값을 더한다. 그리고 PVT의 20주기 EMA를 기준선으로 계산한다. PVT가 EMA를 상향으로 통과하면 다중 신호를 생성하고, PVT가 EMA를 하향으로 통과하면 빈 신호를 생성한다. 이 교차 신호는 시장 추세의 전환점을 결정하는 데 사용됩니다.
전략적 이점
- 양과 가격 결합: 가격과 거래량 데이터를 통합함으로써 전략은 시장 동력을 더 포괄적으로 분석할 수 있다.
- 트렌드 확인: EMA를 필터로 사용하면 가짜 신호를 줄이고 거래의 신뢰도를 높일 수 있습니다.
- 신호 명확: 교차 신호가 명확하고, 조작 실행에 편리하다.
- 적응력: 전략은 다양한 시장 환경에 적용할 수 있으며, 특히 거래량이 크게 변동하는 시장에서 더 잘 작동합니다.
- 변수는 조정할 수 있습니다: EMA 주기는 다른 거래 주기와 시장 특성에 따라 조정할 수 있습니다.
전략적 위험
- 지연성: EMA 사용으로 인해 신호가 다소 지연될 수 있다.
- 흔들림 시장의 불편함: 가로판 흔들림 시장에서 빈번하게 잘못된 신호가 발생할 수 있다.
- 자금 관리: 전략 자체는 스톱로스 스톱을 설정하지 않고, 거래자가 직접 위험을 관리해야 한다.
- 거래량 의존성: 전략의 효과는 거래량 데이터의 품질과 신뢰성에 크게 의존한다.
- 거래 비용: 거래 신호의 빈도는 거래 비용의 증가로 이어질 수 있습니다.
전략 최적화 방향
- 스톱 로드 최적화: ATR 또는 고정 비율 스톱 로드를 사용할 수 있는 동적 스톱 로드 메커니즘을 추가하는 것이 좋습니다.
- 신호 필터: 더 긴 주기 이동 평균과 같은 트렌드 필터를 추가하여 가짜 신호를 줄일 수 있습니다.
- 포지션 관리: 신호 강도와 시장의 변동성에 따라 포지션 크기를 동적으로 조정하는 것이 좋습니다.
- 시간 필터: 거래 시간 필터를 추가하여 큰 변동이있는 시간에 거래하는 것을 피하십시오.
- 다중주기 확인: 신호 신뢰성을 높이기 위해 여러 시간 주기의 확인 메커니즘을 추가하는 것을 고려하십시오.
요약하다
PVT-EMA 트렌드 크로스 전략은 가격, 거래량 및 트렌드 분석을 결합한 완전한 거래 시스템입니다. 약간의 지연 및 잘못된 신호의 위험이 있지만 적절한 최적화 및 위험 관리를 통해 전략은 신뢰할 수있는 거래 도구가 될 수 있습니다. 거래자는 실제 사용 전에 충분한 피드백을 수행하고 특정 시장 특성에 따라 매개 변수 설정을 조정하는 것이 좋습니다.
Source
Pine
Strategy parameters
Related strategies
Comment
All comments (0)
No data
- 1