모멘텀 스윙 트레이딩을 기반으로 한 적응형 추세 추종 전략

1
Follow
1781
Followers
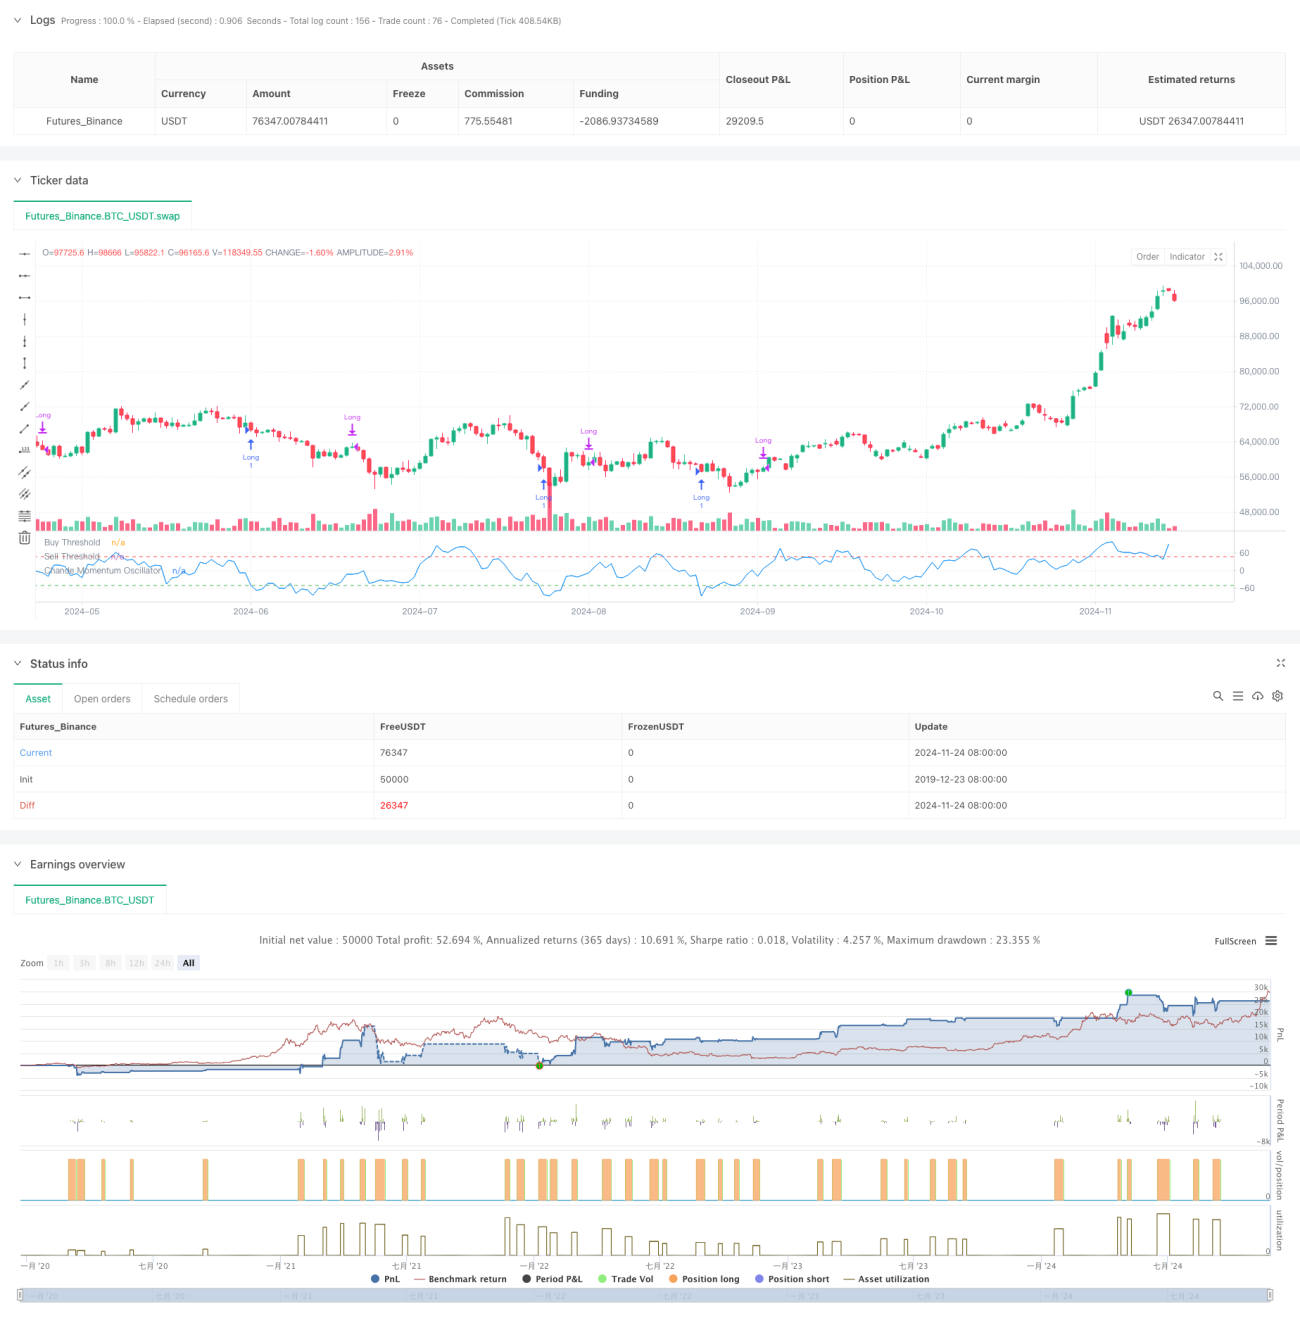
이 전략은 차드 동력 흔들림 지표 ((CMO) 를 기반으로 한 트렌드 추적 거래 시스템이다. 이 전략은 가격 동력을 계산하고 분석하여 과매도 지역에서 구매 기회를 찾고 과매도 지역에서 판매 기회를 찾고 포지션 기간 제한과 함께 위험을 관리합니다. 이 방법은 가격의 역전 기회를 포착하고 흔들림 시장에서 자주 거래되는 것을 피할 수 있습니다.
전략 원칙
전략의 핵심은 시장의 동력을 측정하기 위해 CMO 지표를 사용하는 것입니다. CMO는 상승과 하락의 차이와 총액의 비율을 계산하여 100에서 100 사이의 변동하는 지표 값을 생성합니다. CMO가 50보다 낮으면 시장이 초매 상태에 있음을 나타냅니다.
전략적 이점
- 신호 명확성: 고정된 CMO <unk>값 ((-50 및 50) 을 거래 신호로 사용하여 전략에 명확한 입출구 규칙을 갖는다.
- 위험 제어: 지분 기간을 제한하여 장기적으로 수익성이 없는 지분을 보유하는 것을 피하십시오.
- 트렌드 추적: 시장이 과매매 될 때 진입하고 동력이 약해질 때 적시에 퇴출하여 시장의 흐름을 효과적으로 추적할 수 있다.
- 계산이 간단합니다. CMO 지표 계산 방법은 직관적이고 이해하기 쉽고 실행이 가능합니다.
- 적응력: 전략은 다른 시장 조건에 따라 매개 변수를 조정할 수 있으며, 잘 적응한다.
전략적 위험
- 가짜 돌파 위험: 불안한 시장에서 빈번한 가짜 돌파 신호가 발생할 수 있다.
- 슬라이드 포인트 효과: 빠른 시장에서 실제 거래 가격은 신호 가격과 큰 편차가 있을 수 있다.
- 매개 변수 민감성: CMO 사이클과 <unk>값의 선택이 전략 성능에 큰 영향을 미칩니다.
- 시장 조건 의존성: 추세가 명확하지 않은 시장에서 부진할 수 있다.
- 지연 위험: CMO는 지연 지표로서 입사와 출퇴근 시간에 약간의 지연을 초래할 수 있다.
전략 최적화 방향
- 동적 마이너스: 시장의 변동에 따라 CMO의 입출력 마이너스를 동적으로 조정할 수 있다.
- 다중 시간 주기: 여러 시간 주기의 CMO 지표를 도입하여 신호의 신뢰성을 향상시킵니다.
- 스톱로스 최적화: 스톱로스 추적 기능을 추가하여 수익을 더 잘 보호합니다.
- 포지션 관리: CMO의 수치를 기준으로 포지션 보유량을 조정하여 보다 정밀한 포지션 통제를 구현한다.
- 시장 필터: 트렌드 필터를 추가하여 트렌드가 뚜렷한 시장에서만 거래를 시작합니다.
요약하다
이는 동력에 기반한 트렌드 추적 전략으로, CMO 지표를 통해 시장의 과매매 기회를 포착한다. 전략 설계는 합리적이며, 명확한 거래 규칙과 위험 제어 장치가 있다. 일부 고유한 위험이 존재하지만, 최적화를 통해 전략의 안정성과 수익성을 더욱 향상시킬 수 있다. 전략은 특히 변동성이 큰 시장에 적합하며, 트렌드가 명백한 단계에서 더 나은 수익을 얻을 수 있다.
Source
Pine
Strategy parameters
Related strategies
Comment
All comments (0)
No data
- 1