볼린저 밴드와 RSI를 기반으로 한 동적 비용 평균화 전략 시스템

BB RSI DCA SMA TP
생성 날짜: 2024-11-27 16:37:12 마지막으로 수정됨: 2024-11-27 16:37:12
복사: 0 클릭수: 466
avatar of ChaoZhang ChaoZhang
1
집중하다
1617
수행원

볼린저 밴드와 RSI를 기반으로 한 동적 비용 평균화 전략 시스템

개요

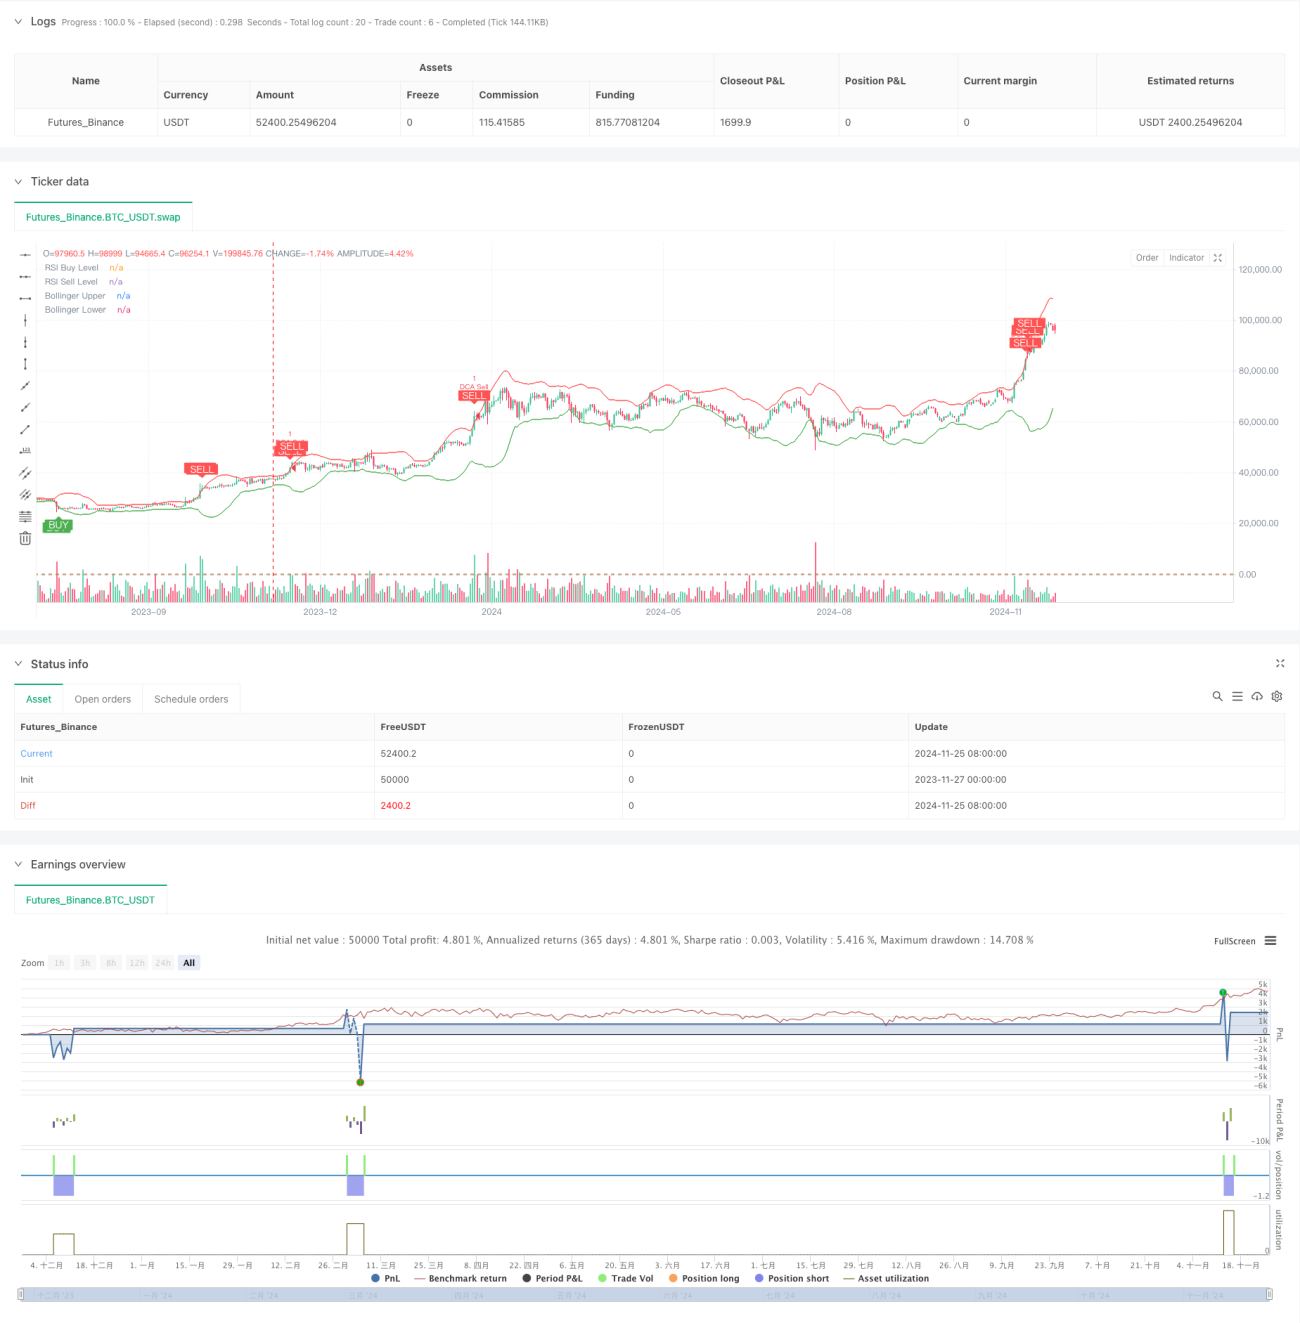
이 전략은 부린 밴드 (Bollinger Bands), 상대적으로 강한 지표 (RSI) 및 동적 비용 평균 (DCA) 을 결합한 정량 거래 시스템이다. 전략은 자금 관리 규칙을 설정하여 시장 변동에 따라 자동으로 대량 포지션 작업을 수행하며 기술 지표와 결합하여 구매 신호 판단을 수행하여 위험을 제어 할 수 있는 거래를 수행한다. 시스템은 또한 정지 논리 및 누적 수익 추적 기능을 포함하여 거래 성과를 효과적으로 모니터링하고 관리 할 수 있습니다.

전략 원칙

이 전략은 주로 다음과 같은 핵심 구성 요소를 기반으로 합니다.

  1. 브린 벨트 지표는 가격 변동의 범위를 판단하는 데 사용되며, 가격이 하향 궤도를 건드렸을 때 구매를 고려하고, 상향 궤도를 건드렸을 때 판매를 고려합니다.
  2. RSI 지표는 시장의 과매매 상태를 확인하는 데 사용됩니다. RSI가 25보다 낮으면 과매매를 확인하고 75 이상이면 과매매를 확인합니다.
  3. DCA 모듈은 계정 권익 역동성에 따라 매번 지분 수치를 계산하여 자금의 자율적 관리를 구현합니다.
  4. 정지 모듈은 5%의 수익률 목표를 설정하여 자동 평점 보호 수익률을 달성합니다.
  5. 시장 상태 모니터링 모듈은 90 일 시장 변화의 크기를 계산하여 전체 경향을 판단하는 데 도움이됩니다.
  6. 누적 수익 추적 모듈은 전략 성과를 평가하기 위해 각 거래의 손실을 기록합니다.

전략적 이점

  1. 다중 기술 지표 크로스 검증과 결합하여 신호 신뢰도를 높여줍니다.
  2. 동적 포지션 관리를 사용하여 고정 포지션의 위험을 피하십시오.
  3. 합리적인 정지 조건을 설정하고 적시에 수익을 고정하십시오.
  4. 시장 추세를 모니터링하여 전체 상황을 파악할 수 있습니다
  5. 전략적 성과를 분석하는 데 도움이 되는 수익 추적 시스템
  6. 알람 기능이 잘 구성되어 있으며, 거래 기회를 실시간으로 알릴 수 있습니다.

전략적 위험

  1. 불안한 시장은 거래비용을 증가시키는 신호를 자주 유발할 수 있습니다.
  2. RSI 지표는 추세 시장에서 지연될 수 있습니다.
  3. 고정 비율 제약이 강세를 보이는 시장에서 조기 퇴출될 수 있다
  4. DCA 전략은 시장의 일방적인 하락으로 인해 더 큰 회전을 초래할 수 있습니다. 위험 관리를 위해 다음과 같은 조치가 권장됩니다.
  • 최대 지분 제한을 설정
  • 시장의 변동성에 따라 동적으로 조정되는 파라미트
  • 트렌드 필터 추가
  • 단계적 차단 전략을 실행하세요.

전략 최적화 방향

  1. 매개변수의 동적 최적화:
  • 브린 밴드 매개 변수는 변동률에 따라 적응할 수 있다.
  • RSI 하락값은 시장주기에 따라 변할 수 있습니다.
  • DCA 자금 비율은 계정 규모에 따라 조정됩니다.
  1. 신호 시스템 강화:
  • 볼륨 증가 확인
  • 트렌드 라인 분석
  • 더 많은 기술 지표와 함께
  1. 리스크 관리가 잘 되어 있습니다.
  • 동적 상쇄를 실현
  • 최대 회수 컨트롤을 추가합니다.
  • 일일 손실 제한을 설정

요약하다

이 전략은 기술 분석과 자금 관리 방법을 종합적으로 적용하여 비교적 완전한 거래 시스템을 구축한다. 전략의 장점은 다중 신호 확인과 완벽한 위험 관리에 있다. 그러나 여전히 실전에서 충분한 테스트와 최적화가 필요하다.

전략 소스 코드
/*backtest
start: 2023-11-27 00:00:00
end: 2024-11-26 00:00:00
period: 1d
basePeriod: 1d
exchanges: [{"eid":"Futures_Binance","currency":"BTC_USDT"}]
*/

//@version=5
strategy("Combined BB RSI with Cumulative Profit, Market Change, and Futures Strategy (DCA)", shorttitle="BB RSI Combined DCA Strategy", overlay=true)

// Input Parameters
length = input.int(20, title="BB Length")  // Adjusted BB length
mult = input.float(2.5, title="BB Multiplier")  // Adjusted BB multiplier
rsiLength = input.int(14, title="RSI Length")  // Adjusted RSI length
rsiBuyLevel = input.int(25, title="RSI Buy Level")  // Adjusted RSI Buy Level
rsiSellLevel = input.int(75, title="RSI Sell Level")  // Adjusted RSI Sell Level
dcaPositionSizePercent = input.float(1, title="DCA Position Size (%)", tooltip="Percentage of equity to use in each DCA step")
takeProfitPercentage = input.float(5, title="Take Profit (%)", tooltip="Take profit percentage for DCA strategy")

// Calculate DCA position size
equity = strategy.equity  // Account equity
dcaPositionSize = (equity * dcaPositionSizePercent) / 100  // DCA position size as percentage of equity

// Bollinger Bands Calculation
basis = ta.sma(close, length)
dev = mult * ta.stdev(close, length)
upper = basis + dev
lower = basis - dev

// RSI Calculation
rsi = ta.rsi(close, rsiLength)

// Plotting Bollinger Bands and RSI levels
plot(upper, color=color.red, title="Bollinger Upper")
plot(lower, color=color.green, title="Bollinger Lower")
hline(rsiBuyLevel, "RSI Buy Level", color=color.green)
hline(rsiSellLevel, "RSI Sell Level", color=color.red)

// Buy and Sell Signals
buySignal = (rsi < rsiBuyLevel and close <= lower)
sellSignal = (rsi > rsiSellLevel and close >= upper)

// DCA Strategy: Enter Long or Short based on signals with calculated position size
if (buySignal)
    strategy.entry("DCA Buy", strategy.long)

if (sellSignal)
    strategy.entry("DCA Sell", strategy.short)

// Take Profit Logic
if (strategy.position_size > 0)  // If long
    strategy.exit("Take Profit Long", from_entry="DCA Buy", limit=close * (1 + takeProfitPercentage / 100))

if (strategy.position_size < 0)  // If short
    strategy.exit("Take Profit Short", from_entry="DCA Sell", limit=close * (1 - takeProfitPercentage / 100))

// Plot Buy/Sell Signals on the chart
plotshape(buySignal, title="Buy Signal", location=location.belowbar, color=color.green, style=shape.labelup, text="BUY", textcolor=color.white)
plotshape(sellSignal, title="Sell Signal", location=location.abovebar, color=color.red, style=shape.labeldown, text="SELL", textcolor=color.white)

// Alerts for Buy/Sell Signals
alertcondition(buySignal, title="Buy Alert", message="Buy Signal Detected")
alertcondition(sellSignal, title="Sell Alert", message="Sell Signal Detected")

// Cumulative Profit Calculation
var float buyPrice = na
var float profit = na
var float cumulativeProfit = 0.0  // Cumulative profit tracker

if (buySignal)
    buyPrice := close
if (sellSignal and not na(buyPrice))
    profit := (close - buyPrice) / buyPrice * 100
    cumulativeProfit := cumulativeProfit + profit  // Update cumulative profit
    label.new(bar_index, high, text="P: " + str.tostring(profit, "#.##") + "%", color=color.blue, style=label.style_label_down)
    buyPrice := na  // Reset buyPrice after sell

// Plot cumulative profit on the chart
var label cumulativeLabel = na
if (not na(cumulativeProfit))
    if not na(cumulativeLabel)
        label.delete(cumulativeLabel)
    cumulativeLabel := label.new(bar_index, high + 10, text="Cumulative Profit: " + str.tostring(cumulativeProfit, "#.##") + "%", color=color.purple, style=label.style_label_up)

// Market Change over 3 months Calculation
threeMonthsBars = 3 * 30 * 24  // Approximation of 3 months in bars (assuming 1 hour per bar)
priceThreeMonthsAgo = request.security(syminfo.tickerid, "D", close[threeMonthsBars])
marketChange = (close - priceThreeMonthsAgo) / priceThreeMonthsAgo * 100

// Plot market change over 3 months
var label marketChangeLabel = na
if (not na(marketChange))
    if not na(marketChangeLabel)
        label.delete(marketChangeLabel)
    marketChangeLabel := label.new(bar_index, high + 20, text="Market Change (3 months): " + str.tostring(marketChange, "#.##") + "%", color=color.orange, style=label.style_label_up)

// Both labels (cumulative profit and market change) are displayed simultaneously
var label infoLabel = na
if (not na(cumulativeProfit) and not na(marketChange))
    if not na(infoLabel)
        label.delete(infoLabel)
    infoLabel := label.new(bar_index, high + 30, text="Cumulative Profit: " + str.tostring(cumulativeProfit, "#.##") + "% | Market Change (3 months): " + str.tostring(marketChange, "#.##") + "%", color=color.purple, style=label.style_label_upper_right)