다중 지표 교차 추세 추적과 거래량 및 가격을 결합한 적응형 거래 전략

MACD RSI RVI EMA
생성 날짜: 2024-11-27 16:58:35 마지막으로 수정됨: 2024-11-27 16:58:35
복사: 0 클릭수: 446
avatar of ChaoZhang ChaoZhang
1
집중하다
1617
수행원

다중 지표 교차 추세 추적과 거래량 및 가격을 결합한 적응형 거래 전략

개요

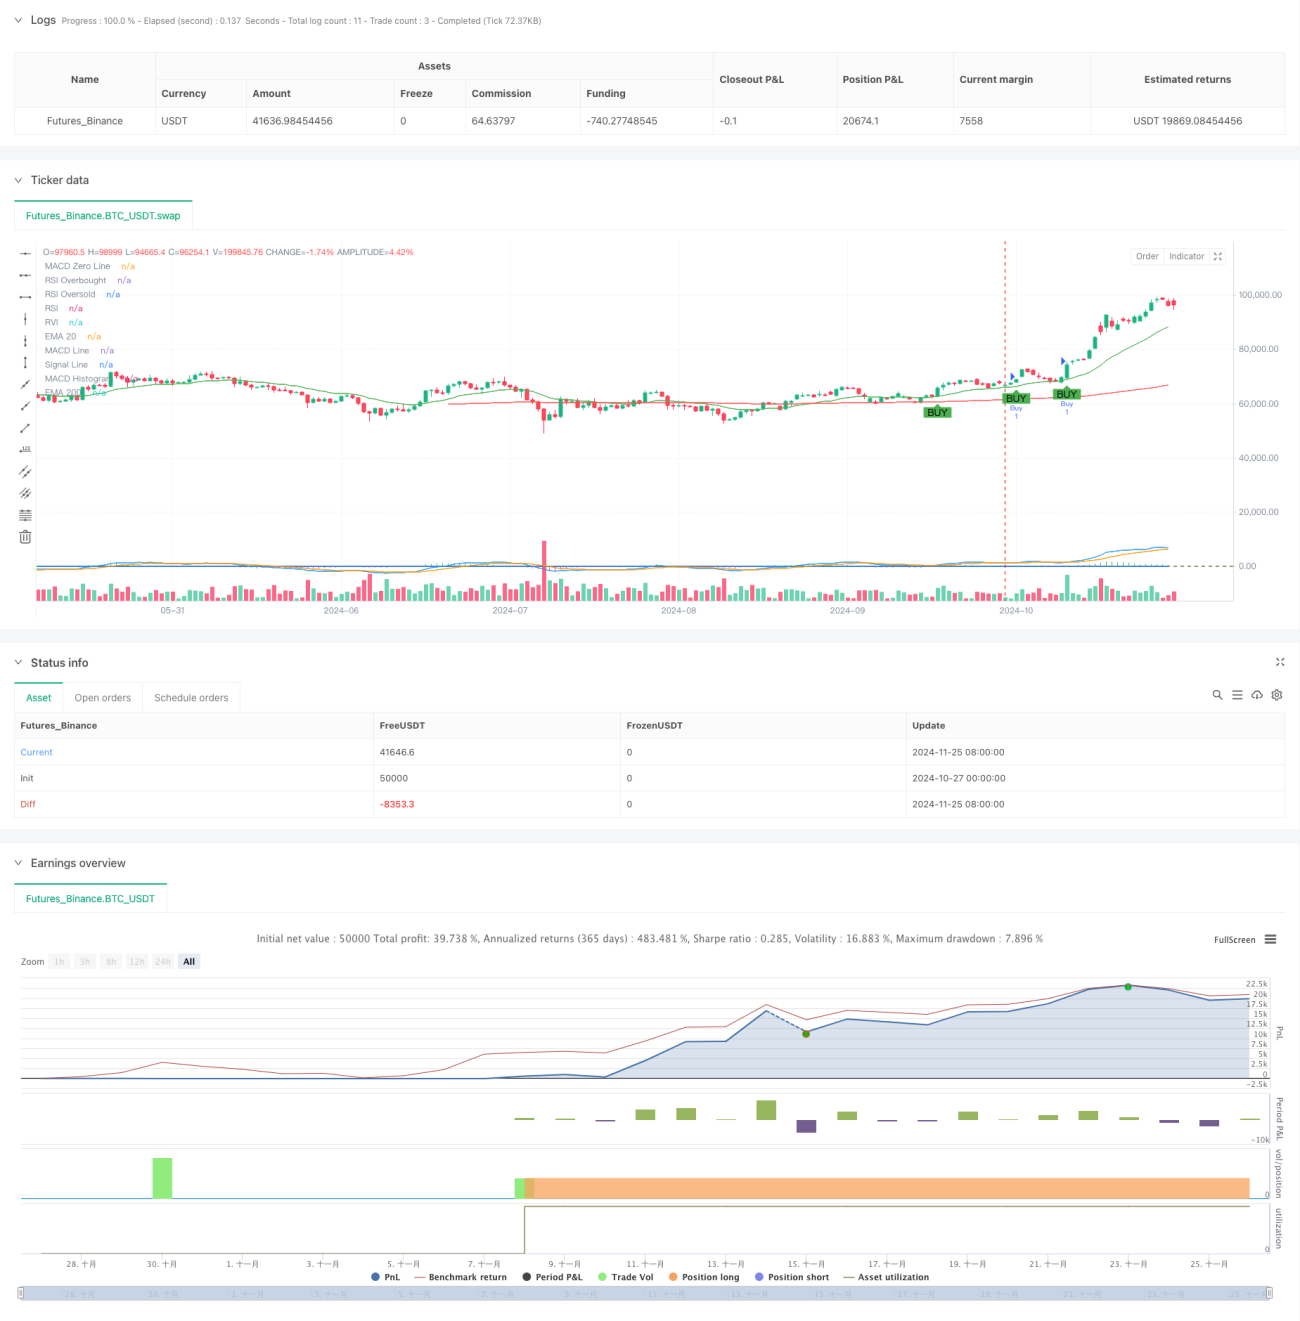
이 전략은 여러 기술 지표와 결합 된 트렌드 추적 거래 시스템으로 MACD, RSI, RVI, EMA와 같은 지표의 교차 신호와 거래량 확인을 통해 시장의 흐름을 식별하고, 트래킹 스톱 로스를 사용하여 위험을 관리합니다. 전략은 특정 가격 범위 내에서 운영되며, 여러 신호의 통합 판단을 통해 거래의 정확성과 신뢰성을 향상시킵니다.

전략 원칙

전략은 여러 계층의 신호 검증 메커니즘을 채택하고 있으며, 다음과 같은 몇 가지 핵심 구성 요소를 포함합니다. 첫째, 20주기 및 200주기의 지수 이동 평균 ((EMA) 를 사용하여 전체 시장의 추세를 결정합니다. 둘째, MACD 지표 ((12,26,9) 의 교차를 사용하여 추세의 전환점을 포착합니다. 셋째, 상대적으로 강한 지표 ((RSI) 와 상대적으로 변동하는 지표 ((RVI) 를 사용하여 시장의 과매매 상태를 확인합니다. 마지막으로 거래 지표 (RVI) 를 통해 거래를 확인합니다.

전략적 이점

  1. 복수신호 검증 메커니즘은 가짜 침입의 위험을 크게 줄였습니다.
  2. 트렌드 추적과 흔들림 지표의 조합으로 다양한 시장 환경에서 안정성을 유지할 수 있습니다.
  3. 거래량 확인을 통해 거래 신호의 신뢰성을 높여줍니다.
  4. 손실을 추적하는 스톱 메커니즘은 수익을 효과적으로 보호합니다.
  5. 가격 범위 제한은 극단적인 상황에서 과도한 거래를 방지할 수 있습니다.
  6. 지표의 매개 변수는 시장 상황에 따라 유연하게 조정할 수 있습니다.
  7. 시스템 확장성과 적응성이 뛰어나다.

전략적 위험

  1. 다중 조건으로 인해 중요한 거래 기회를 놓칠 수 있습니다.
  2. 수평 변동 시장에서 빈번한 잘못된 신호가 발생할 수 있습니다.
  3. 고정된 가격 범위 제한으로 인해 전략이 중요한 돌파구를 놓칠 수 있습니다.
  4. 기술 지표에 지나치게 의존하면 근본적인 요소의 영향을 무시할 수 있습니다.
  5. 트래킹 스톱은 급격한 변동이 있을 때 조기 시작될 수 있습니다.

전략 최적화 방향

  1. 시장의 변동에 따라 각 지표의 매개 변수를 동적으로 조정하는 적응 매개 변수 메커니즘을 도입합니다.
  2. 시장의 전환점을 예측할 수 있는 시장 정서 지표를 추가합니다.
  3. 동적 가격 범위를 판단하는 메커니즘을 개발하여 전략을 더 유연하게 만듭니다.
  4. 불리한 시간에 거래하는 것을 피하기 위해 시간 주기 필터를 추가하십시오.
  5. 손해배상 제도를 최적화하고, 변동율 기반의 동적 손해배상 도입을 고려한다.
  6. 리스크 관리 모듈을 추가하여 더 나은 포지션 관리

요약하다

이 전략은 여러 가지 기술 지표의 조합을 사용하여 비교적 완전한 거래 시스템을 구축한다. 제한이 있기는 하지만, 합리적인 변수 최적화와 위험 관리를 통해 전략은 좋은 실용적 가치를 가지고 있다. 미래에는 더 많은 적응 장치와 위험 제어 수단을 도입하여 전략의 안정성과 수익성을 향상시킬 수 있다.

전략 소스 코드
/*backtest
start: 2024-10-27 00:00:00
end: 2024-11-26 00:00:00
period: 1d
basePeriod: 1d
exchanges: [{"eid":"Futures_Binance","currency":"BTC_USDT"}]
*/

//@version=5
strategy("MACD/RSI/RVI/EMA20-200/Volume BTC Auto Trading Bot", overlay=true, margin_long=100, margin_short=100)

// Parámetros de EMA
ema20Length = input(20, title="EMA 20 Length")
ema200Length = input(200, title="EMA 200 Length")

// Parámetros de MACD
macdFastLength = input(12, title="MACD Fast Length")
macdSlowLength = input(26, title="MACD Slow Length")
macdSignalSmoothing = input(9, title="MACD Signal Smoothing")

// Parámetros de RSI y RVI
rsiLength = input(14, title="RSI Length")
rviLength = input(14, title="RVI Length")

// Volumen mínimo para operar
minVolume = input(100, title="Min Volume to Enter Trade")

// Rango de precios de BTC entre 60k y 80k
minPrice = 60000
maxPrice = 80000

// Rango de precios BTC
inPriceRange = close >= minPrice and close <= maxPrice

// Cálculo de las EMAs
ema20 = ta.ema(close, ema20Length)
ema200 = ta.ema(close, ema200Length)
plot(ema20, color=color.green, title="EMA 20")
plot(ema200, color=color.red, title="EMA 200")

// Cálculo del MACD
[macdLine, signalLine, _] = ta.macd(close, macdFastLength, macdSlowLength, macdSignalSmoothing)
macdHist = macdLine - signalLine
plot(macdLine, color=color.blue, title="MACD Line")
plot(signalLine, color=color.orange, title="Signal Line")
hline(0, "MACD Zero Line", color=color.gray)
plot(macdHist, style=plot.style_histogram, color=(macdHist >= 0 ? color.green : color.red), title="MACD Histogram")

// Cálculo del RSI
rsi = ta.rsi(close, rsiLength)
hline(70, "RSI Overbought", color=color.red)
hline(30, "RSI Oversold", color=color.green)
plot(rsi, color=color.purple, title="RSI")

// Cálculo del RVI
numerator = (close - open) + 2 * (close[1] - open[1]) + 2 * (close[2] - open[2]) + (close[3] - open[3])
denominator = (high - low) + 2 * (high[1] - low[1]) + 2 * (high[2] - low[2]) + (high[3] - low[3])
rvi = ta.sma(numerator / denominator, rviLength)
plot(rvi, color=color.blue, title="RVI")

// Volumen
volumeCondition = volume > minVolume

// Condiciones de compra
bullishCondition = ta.crossover(macdLine, signalLine) and rsi < 70 and rvi > 0 and close > ema20 and close > ema200 and inPriceRange and volumeCondition

// Condiciones de venta
bearishCondition = ta.crossunder(macdLine, signalLine) and rsi > 30 and rvi < 0 and close < ema20 and close < ema200 and inPriceRange and volumeCondition

// Configuración del trailing stop loss
trail_stop = input(true, title="Enable Trailing Stop")
trail_offset = input.float(0.5, title="Trailing Stop Offset (%)", step=0.1)

// Funciones para la gestión del Trailing Stop Loss
if (bullishCondition)
    strategy.entry("Buy", strategy.long)
    var float highestPrice = na
    highestPrice := na(highestPrice) ? high : math.max(high, highestPrice)
    strategy.exit("Trailing Stop", "Buy", stop=highestPrice * (1 - trail_offset / 100))

if (bearishCondition)
    strategy.entry("Sell", strategy.short)
    var float lowestPrice = na
    lowestPrice := na(lowestPrice) ? low : math.min(low, lowestPrice)
    strategy.exit("Trailing Stop", "Sell", stop=lowestPrice * (1 + trail_offset / 100))
plotshape(bullishCondition, title="Buy Signal", location=location.belowbar, color=color.new(color.green, 0), style=shape.labelup, text="BUY")
plotshape(bearishCondition, title="Sell Signal", location=location.abovebar, color=color.new(color.red, 0), style=shape.labeldown, text="SELL")