클라우드 차트 돌파 및 손절매 시스템과 결합된 다중 기술 지표 추세 추적 전략

RSI MA SMA EMA
생성 날짜: 2024-11-28 15:13:23 마지막으로 수정됨: 2024-11-28 15:13:23
복사: 0 클릭수: 484
avatar of ChaoZhang ChaoZhang
1
집중하다
1617
수행원

클라우드 차트 돌파 및 손절매 시스템과 결합된 다중 기술 지표 추세 추적 전략

개요

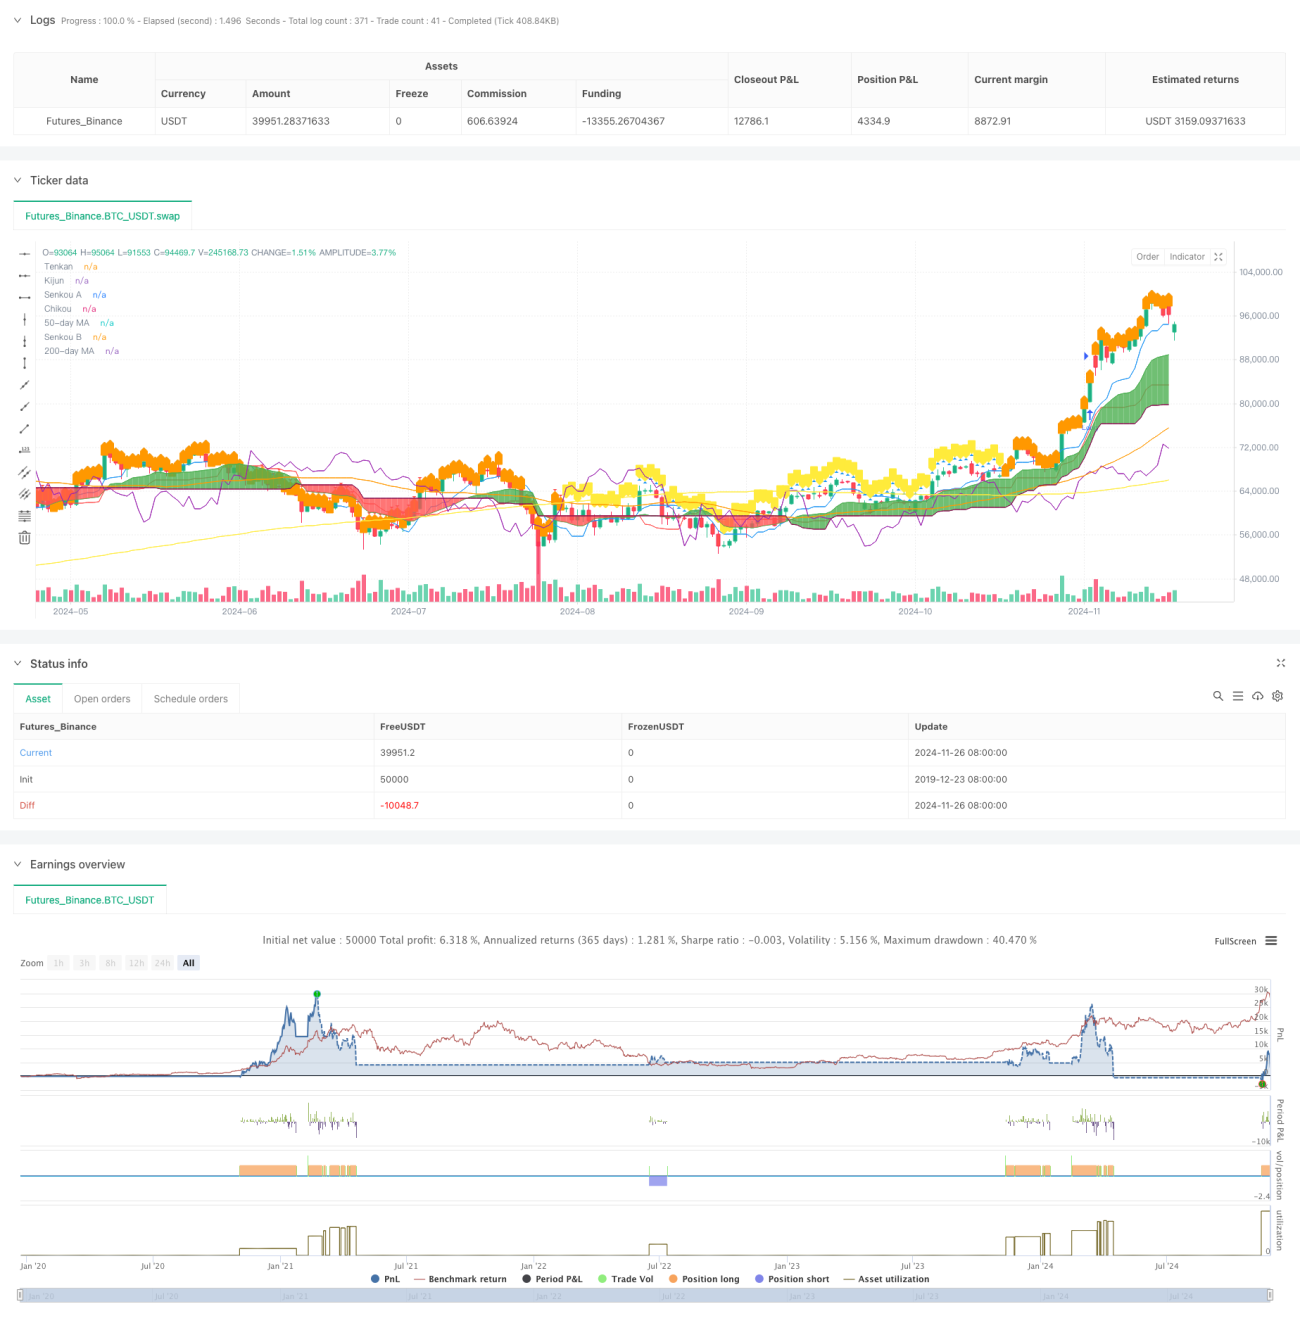
이 전략은 일련의 기술 지표들을 결합한 완전한 거래 시스템으로, 주로 일회용 구름 도표 (Ichimoku Cloud) 를 기반으로 거래 결정을 내린다. 시스템은 안테나 (Tenkan) 와 기준선 (Kijun) 의 교차를 통해 진출 시기를 결정하며, 상대적으로 약한 지수 (RSI) 와 이동 평균 (MA) 를 보조 필터링 조건으로 결합한다. 전략은 구름 도표 구성 요소를 동적 스톱 로즈로 사용하여, 완전한 위험 제어 시스템을 형성한다.

전략 원칙

전략의 핵심 논리는 다음과 같은 핵심 요소에 기초합니다.

  1. 입력 신호는 안테나와 기준선의 교차로 생성되며, 상단穿은 다중 신호로 형성되며, 하단穿은 공백 신호로 형성된다.
  2. 구름에 대한 가격 위치의 관계 (Kumo) 트렌드 확인으로, 가격은 구름 위에 더 많이 하고, 가격은 구름 아래에 빈
  3. 트렌드 필터 조건으로 50일 및 200일 이동 평균의 위치 관계
  4. 주변 RSI 지표는 시장의 강하고 약한 확인으로, 가짜 신호를 필터링합니다.
  5. 클라우드 상단 및 하단 경계를 동적 중지 위치로 사용하여 위험 동적 관리를 수행합니다.

전략적 이점

  1. 다중 기술 지표의 조합은 더 신뢰할 수 있는 거래 신호를 제공하며, 가짜 신호의 영향을 크게 줄입니다.
  2. 클라우드 그래프를 동적 스톱 포지션으로 사용하여 시장의 변동에 따라 자동으로 스톱 포지션을 조정하여 수익을 보호하고 가격에 충분한 변동 공간을 제공합니다.
  3. 회로 RSI 필터링을 통해 과도한 과매매 영역에서 불리한 거래를 효과적으로 방지합니다.
  4. 이동 평균의 교차는 추가적인 트렌드 확인을 제공하여 거래의 성공률을 높입니다.
  5. 입출장, 지분, 출출장과 관련된 전체적인 위험 관리 시스템

전략적 위험

  1. 다중 지표 필터링은 잠재적인 좋은 기회를 놓치게 할 수 있습니다.
  2. 변동성이 큰 시장에서는 빈번하게 잘못된 돌파 신호가 발생할 수 있습니다.
  3. 클라우드 그래프 지표 자체는 다소 지연되어 입시 시점에 영향을 미칠 수 있습니다.
  4. 빠르게 변동하는 시장에서 동적 중지 지점은 너무 느슨할 수 있습니다.
  5. 과도한 필터링 조건은 거래 기회의 감소로 전략의 전체 수익에 영향을 미칠 수 있습니다.

전략 최적화 방향

  1. 시장의 변동에 따라 전략 변수를 조정하는 변동률 지표를 도입합니다.
  2. 다른 시장 환경에 더 적합하도록 클라우드 그래프 파라미터 설정을 최적화합니다.
  3. 거래량 분석을 늘리고 신호의 신뢰성을 높여라
  4. 시간 필터링을 도입하여 큰 변동성을 피할 수 있습니다.
  5. 전략의 동적 조정을 구현하기 위해 적응 가능한 변수 최적화 시스템을 개발합니다.

요약하다

이 전략은 여러 기술 지표를 결합하여 완전한 거래 시스템을 구축한다. 이 전략은 신호의 발생에 초점을 맞추는 것뿐만 아니라 완벽한 위험 제어 장치도 포함하고 있다. 여러 필터링 조건을 설정하여 거래의 성공률을 효과적으로 향상시킨다. 동시에, 동적 중지 손실 디자인은 전략에 좋은 위험 수익률을 제공합니다.

전략 소스 코드
/*backtest
start: 2019-12-23 08:00:00
end: 2024-11-27 00:00:00
period: 1d
basePeriod: 1d
exchanges: [{"eid":"Futures_Binance","currency":"BTC_USDT"}]
*/

//@version=5
strategy("Ichimoku Strategy with Optional RSI, MA Filters and Alerts", overlay=true)

// Input for date and time filter
startDate = input(timestamp("2020-01-01 00:00"), title="Start Date")
endDate = input(timestamp("2023-01-01 00:00"), title="End Date")

// Inputs for Ichimoku settings
tenkanPeriod = input.int(9, title="Tenkan Period")
kijunPeriod = input.int(26, title="Kijun Period")
senkouBPeriod = input.int(52, title="Senkou B Period")

// Inputs for Moving Average settings
useMAFilter = input.bool(true, title="Enable Moving Average Filter?")
ma50Period = input.int(50, title="50-day MA Period")
ma200Period = input.int(200, title="200-day MA Period")

// Inputs for RSI settings
useRSIFilter = input.bool(true, title="Enable RSI Filter?")
rsiPeriod = input.int(14, title="RSI Period")
rsiOverbought = input.int(70, title="RSI Overbought Level")
rsiOversold = input.int(30, title="RSI Oversold Level")

// Ichimoku Cloud components
tenkan = (ta.highest(high, tenkanPeriod) + ta.lowest(low, tenkanPeriod)) / 2
kijun = (ta.highest(high, kijunPeriod) + ta.lowest(low, kijunPeriod)) / 2
senkouA = ta.sma(tenkan + kijun, 2) / 2
senkouB = (ta.highest(high, senkouBPeriod) + ta.lowest(low, senkouBPeriod)) / 2
chikou = close[26]

// Moving Averages
ma50 = ta.sma(close, ma50Period)
ma200 = ta.sma(close, ma200Period)

// Weekly RSI
rsiSource = request.security(syminfo.tickerid, "W", ta.rsi(close, rsiPeriod))

// Plotting the Ichimoku Cloud components
pTenkan = plot(tenkan, color=color.blue, title="Tenkan")
pKijun = plot(kijun, color=color.red, title="Kijun")
pSenkouA = plot(senkouA, color=color.green, title="Senkou A")
pSenkouB = plot(senkouB, color=color.maroon, title="Senkou B")
plot(chikou, color=color.purple, title="Chikou")
plot(ma50, color=color.orange, title="50-day MA")
plot(ma200, color=color.yellow, title="200-day MA")

// Corrected fill function
fill(pSenkouA, pSenkouB, color=senkouA > senkouB ? color.green : color.red, transp=90)

// Debugging: Output values on the chart to see if conditions are ever met
plotshape(series=(tenkan > kijun), color=color.blue, style=shape.triangleup, title="Tenkan > Kijun")
plotshape(series=(tenkan < kijun), color=color.red, style=shape.triangledown, title="Tenkan < Kijun")
plotshape(series=(ma50 > ma200), color=color.orange, style=shape.labelup, title="MA 50 > MA 200")
plotshape(series=(ma50 < ma200), color=color.yellow, style=shape.labeldown, title="MA 50 < MA 200")

// Define the trailing stop loss using Kumo
var float trailingStopLoss = na

// Check for MA conditions (apply only if enabled)
maConditionLong = not useMAFilter or (useMAFilter and ma50 > ma200)
maConditionShort = not useMAFilter or (useMAFilter and ma50 < ma200)

// Check for Ichimoku Cloud conditions
ichimokuLongCondition = close > math.max(senkouA, senkouB)
ichimokuShortCondition = close < math.min(senkouA, senkouB)

// Check for RSI conditions (apply only if enabled)
rsiConditionLong = not useRSIFilter or (useRSIFilter and rsiSource > rsiOverbought)
rsiConditionShort = not useRSIFilter or (useRSIFilter and rsiSource < rsiOversold)

// Combine conditions for entry
longCondition = maConditionLong and tenkan > kijun and ichimokuLongCondition and rsiConditionLong
shortCondition = maConditionShort and tenkan < kijun and ichimokuShortCondition and rsiConditionShort

// Date and time filter
withinDateRange = true

// Check for Long Condition
if (longCondition and withinDateRange) 
    strategy.entry("Long", strategy.long)
    trailingStopLoss := math.min(senkouA, senkouB)
    alert("Buy Signal: Entering Long Position", alert.freq_once_per_bar_close)

// Check for Short Condition
if (shortCondition and withinDateRange) 
    strategy.entry("Short", strategy.short)
    trailingStopLoss := math.max(senkouA, senkouB)
    alert("Sell Signal: Entering Short Position", alert.freq_once_per_bar_close)

// Exit conditions
exitLongCondition = close < kijun or tenkan < kijun
exitShortCondition = close > kijun or tenkan > kijun

if (exitLongCondition and strategy.position_size > 0)
    strategy.close("Long")
    alert("Exit Signal: Closing Long Position", alert.freq_once_per_bar_close)

if (exitShortCondition and strategy.position_size < 0)
    strategy.close("Short")
    alert("Exit Signal: Closing Short Position", alert.freq_once_per_bar_close)

// Apply trailing stop loss
if (strategy.position_size > 0)
    strategy.exit("Trailing Stop Long", stop=trailingStopLoss)
else if (strategy.position_size < 0)
    strategy.exit("Trailing Stop Short", stop=trailingStopLoss)