고주파 동적 다중 지표 이동 평균 교차 전략

EMA RSI ATR VWAP SMA
생성 날짜: 2024-11-28 15:29:06 마지막으로 수정됨: 2024-11-28 15:29:06
복사: 0 클릭수: 500
avatar of ChaoZhang ChaoZhang
1
집중하다
1617
수행원

고주파 동적 다중 지표 이동 평균 교차 전략

개요

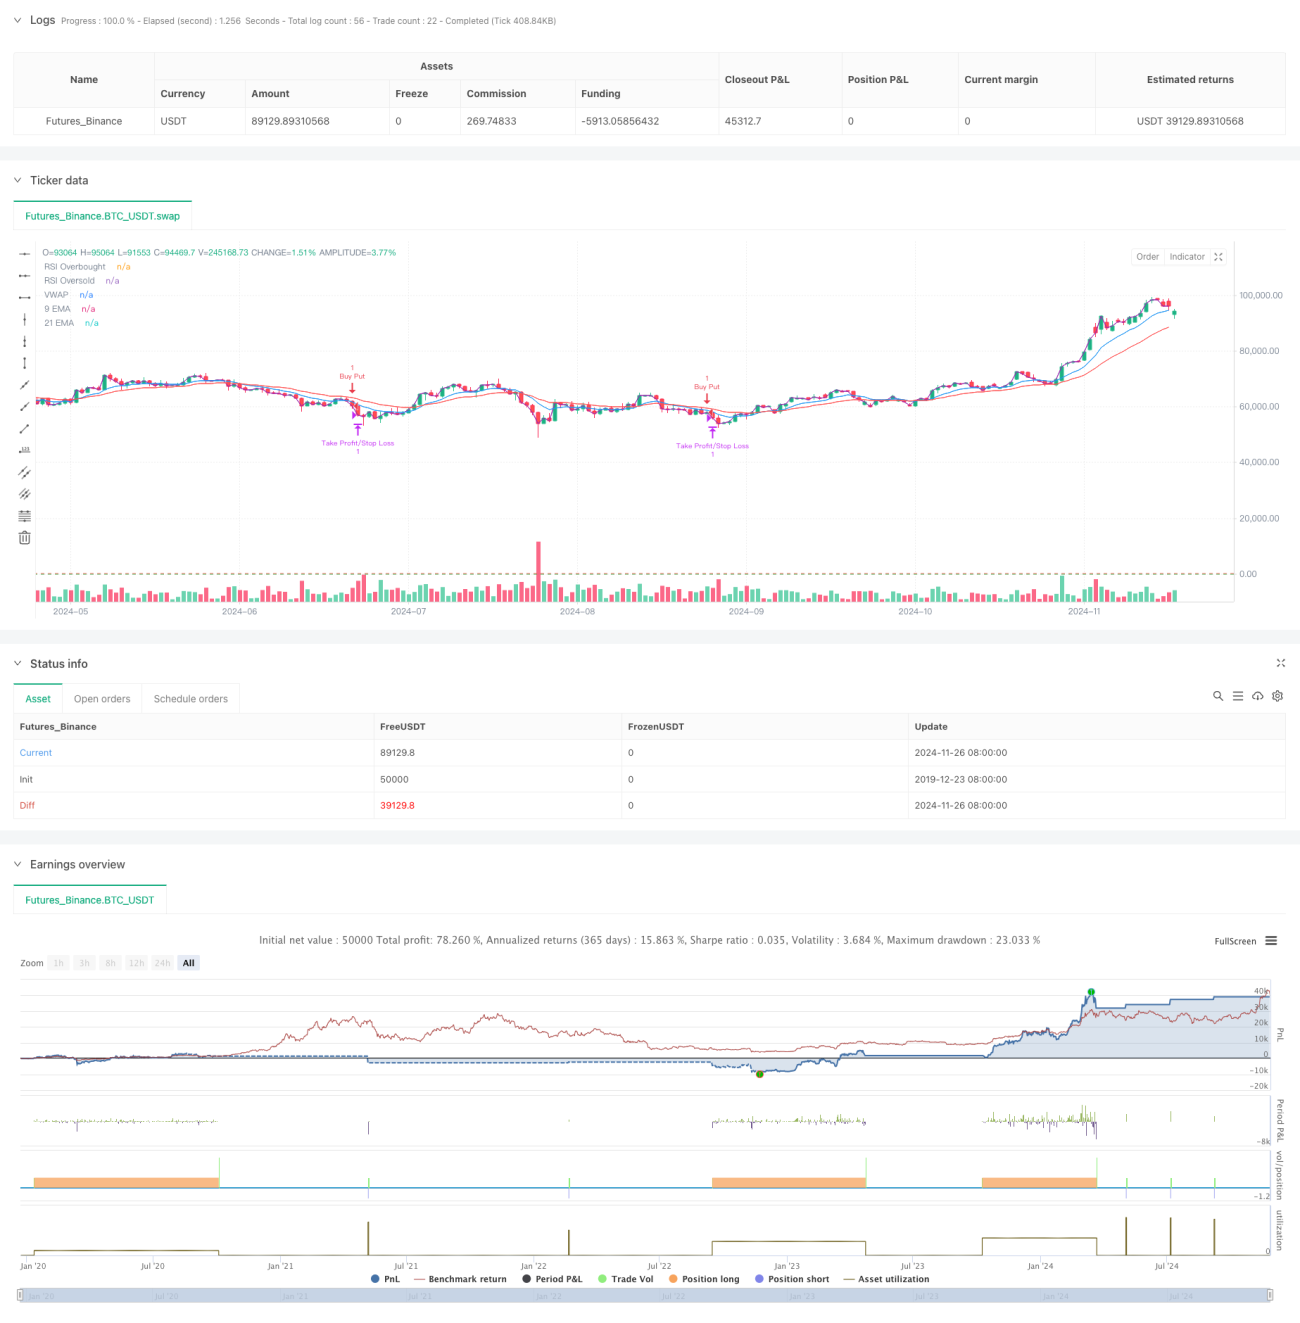
이 전략은 다중 기술 지표에 기반한 고주파 거래 시스템으로, 5분 시간 프레임에, 평행 시스템, 동적 지표, 거래량 분석을 결합한다. 이 전략은 동적으로 조정하는 방식으로 시장의 변동에 적응하고, 다중 신호 확인을 사용하여 거래의 정확성과 신뢰성을 향상시킨다. 전략의 핵심은 다차원 기술 지표의 조합을 통해 단기 시장 추세를 포착하는 데 있으며, 동적 스톱 로스를 사용하여 위험을 제어한다.

전략 원칙

이 전략은 쌍평균선 시스템 ((9주기 및 21주기 EMA) 을 주요 트렌드 판단 도구로 사용하고 RSI 지표와 결합하여 동력을 확인한다. 가격이 쌍평균선 위에 있고 RSI가 40-65 영역에 있을 때, 시스템은 더 많은 기회를 찾는다. 가격이 쌍평균선 아래에 있고 RSI가 35-60 영역에 있을 때, 시스템은 빈 기회를 찾는다. 동시에, 전략은 거래량 확인 메커니즘을 도입하여 현재 거래량이 20주기 이동 평균 거래량보다 1.2배가 필요하다는 것을 요구한다. VWAP의 사용은 거래 방향과 주류 트렌드를 일일 유지하도록 추가로 보장한다.

전략적 이점

  1. 다중 신호 확인 메커니즘은 거래의 신뢰성을 크게 향상시킵니다.
  2. 동적 스톱 스톱 손실 설정은 다양한 시장 환경에 적응할 수 있습니다.
  3. 극한 지역에서 거래하는 것을 피하기 위해 좀 더 보수적인 RSI 마이너스를 사용하십시오.
  4. 거래량 확인 메커니즘은 가짜 신호를 효과적으로 필터링합니다.
  5. VWAP의 사용은 거래 방향이 주류 자금과 일치하는 것을 보장합니다.
  6. 신속한 대응, 일률적인 시스템은 단기 시장 기회를 포착하는 데 적합합니다.

전략적 위험

  1. 수평 변동 시장에서 빈번한 잘못된 신호가 발생할 수 있습니다.
  2. 다중 조건의 제한은 일부 거래 기회를 놓치게 할 수 있습니다.
  3. 높은 주파수 거래는 높은 거래 비용에 직면할 수 있습니다.
  4. 시장이 급변할 때 반응이 느릴 수 있습니다.
  5. 시장 데이터에 대한 높은 실시간 요구

전략 최적화 방향

  1. 시장 상황에 따라 동적으로 지표 파라미터를 조정할 수 있도록 적응형 파라미터 조정 메커니즘을 도입
  2. 시장 환경 인식 모듈을 추가하여 다른 시장 조건에서 다른 거래 전략을 사용합니다.
  3. 트랜지먼트 필터링 조건을 최적화하기 위해 상대 트랜지먼트 또는 트랜지먼트 서면 분석을 사용할 수 있습니다.
  4. 손해 차단 기능을 개선하여 손해 추적 기능을 추가하는 것을 고려할 수 있습니다.
  5. 거래 시간 필터를 추가하여 큰 변동의 개시 및 종료 시기를 피하십시오.

요약하다

이 전략은 여러 가지 기술 지표의 조합을 사용하여 비교적 완전한 거래 시스템을 구축한다. 전략의 장점은 다차원적인 신호 확인 메커니즘과 동적인 위험 제어 방법이다. 일부 잠재적인 위험이 있지만 합리적인 매개 변수 최적화 및 위험 관리를 통해 전략은 여전히 좋은 응용 가치가있다.

전략 소스 코드
/*backtest
start: 2019-12-23 08:00:00
end: 2024-11-27 00:00:00
period: 1d
basePeriod: 1d
exchanges: [{"eid":"Futures_Binance","currency":"BTC_USDT"}]
*/

//@version=5
strategy("Optimized Nifty MidCap Select Options 5-min Intraday Strategy", overlay=true)

// Parameters
emaShortPeriod = input.int(9, title="Short EMA")
emaLongPeriod = input.int(21, title="Long EMA")
rsiPeriod = input.int(14, title="RSI Period")
rsiOverbought = input.int(65, title="RSI Overbought Level") // More conservative than 70
rsiOversold = input.int(35, title="RSI Oversold Level") // More conservative than 30
atrLength = input.int(14, title="ATR Length")
atrMultiplier = input.float(1.5, title="ATR Multiplier")
volumeMultiplier = input.float(1.2, title="Volume Multiplier") // For confirming high-volume trades

// EMA Calculation
emaShort = ta.ema(close, emaShortPeriod)
emaLong = ta.ema(close, emaLongPeriod)

// RSI Calculation
rsiValue = ta.rsi(close, rsiPeriod)

// ATR Calculation
atrValue = ta.atr(atrLength)

// VWAP Calculation
vwapValue = ta.vwap(close)

// Volume Check
volumeCondition = volume > ta.sma(volume, 20) * volumeMultiplier

// Define long and short conditions

// Long Condition: 
// Price above both EMAs, RSI not overbought, price above VWAP, and high volume
longCondition = (close > emaShort) and (close > emaLong) and (rsiValue > 40 and rsiValue < rsiOverbought) and (close > vwapValue) and volumeCondition

// Short Condition: 
// Price below both EMAs, RSI not oversold, price below VWAP, and high volume
shortCondition = (close < emaShort) and (close < emaLong) and (rsiValue < 60 and rsiValue > rsiOversold) and (close < vwapValue) and volumeCondition

// Entry logic
if (longCondition)
    strategy.entry("Buy Call", strategy.long)
if (shortCondition)
    strategy.entry("Buy Put", strategy.short)

// Dynamic Take Profit and Stop Loss based on ATR
takeProfitLevel = strategy.position_avg_price * (1 + atrValue * atrMultiplier / 100)
stopLossLevel = strategy.position_avg_price * (1 - atrValue * atrMultiplier / 100)

// Exit strategy based on ATR levels
strategy.exit("Take Profit/Stop Loss", from_entry="Buy Call", limit=takeProfitLevel, stop=stopLossLevel)
strategy.exit("Take Profit/Stop Loss", from_entry="Buy Put", limit=takeProfitLevel, stop=stopLossLevel)

// Plotting indicators
plot(emaShort, title="9 EMA", color=color.blue)
plot(emaLong, title="21 EMA", color=color.red)
hline(rsiOverbought, "RSI Overbought", color=color.red)
hline(rsiOversold, "RSI Oversold", color=color.green)
plot(vwapValue, title="VWAP", color=color.purple)