RSI 트렌드 모멘텀 트레이딩 전략과 이중 이동 평균 및 볼륨 확인의 결합

1
Follow
1781
Followers
개요
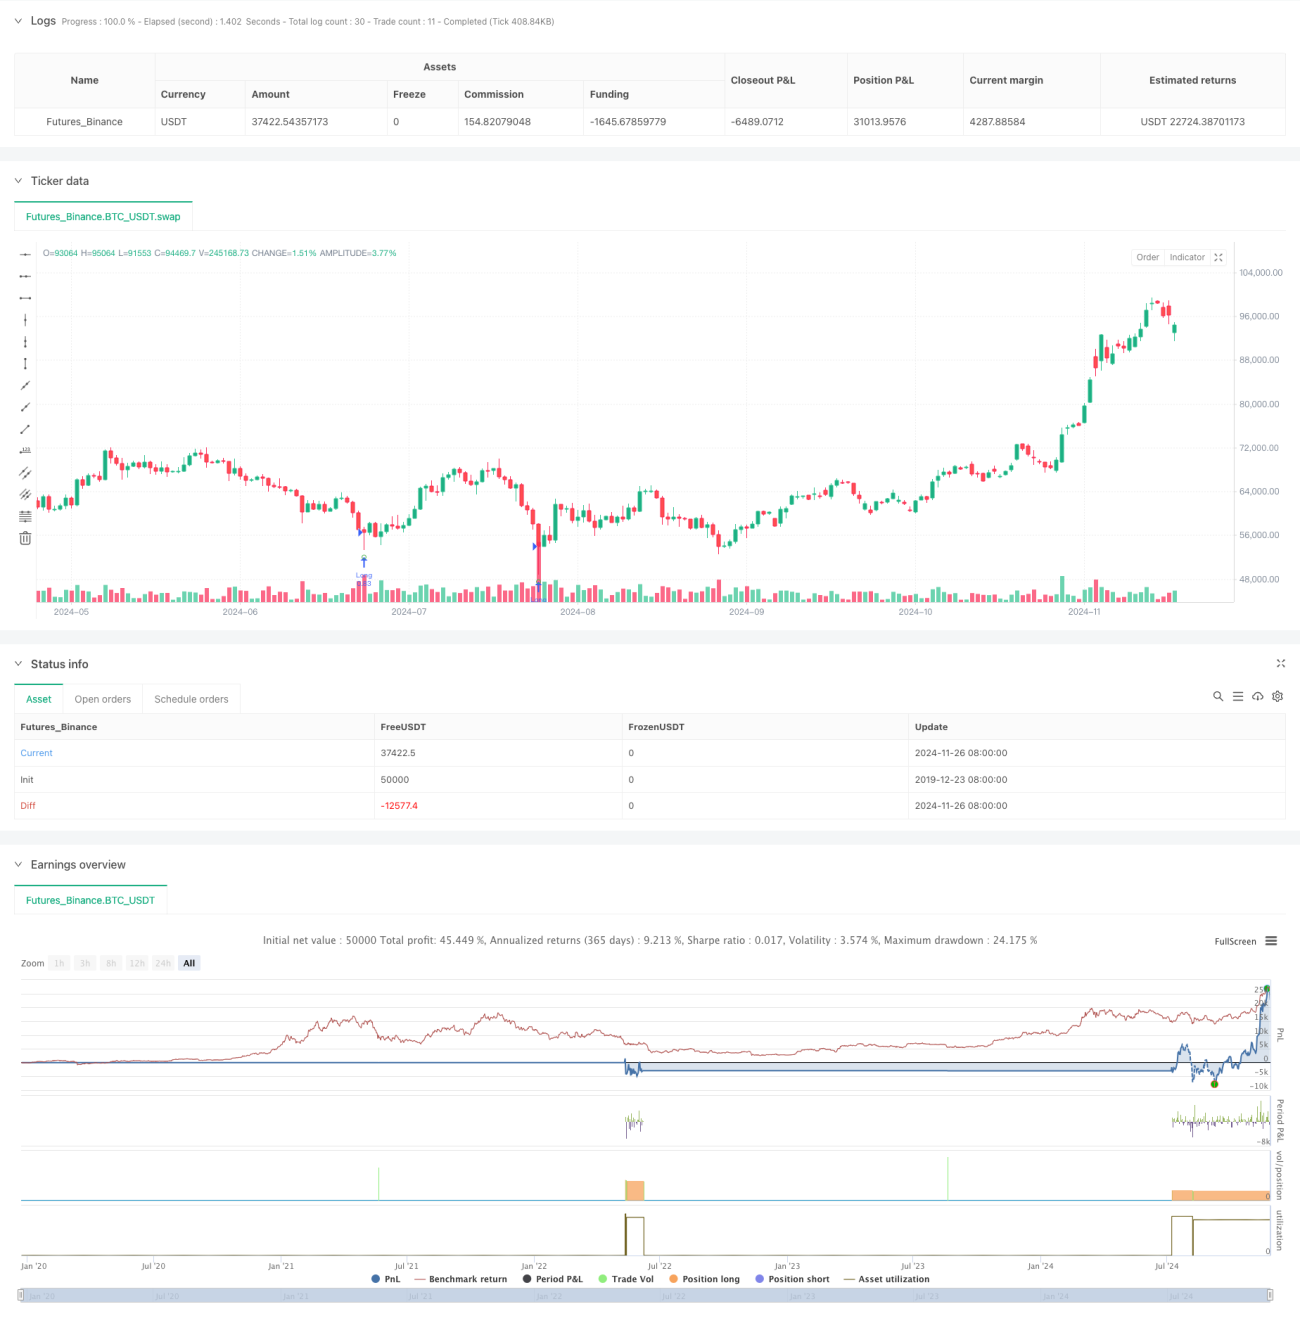
이 전략은 RSI 과매매 신호, 장기 단기 평균선 트렌드 및 거래량 확인에 기반한 트렌드 추적 전략이다. 이 전략은 주로 장기 상승 추세에서 단기 과매매 기회를 식별하여 다수 포지션을 구축하며 거래량을 확대하여 거래 신호의 유효성을 확인한다. 이 전략은 10주기 RSI 지표, 250 및 500주기 쌍평선 시스템, 그리고 20주기 거래량 평균선을 핵심 지표 제품군으로 사용합니다.
전략 원칙
이 전략의 핵심 논리는 다음과 같은 세 가지 핵심 조건에 기반합니다.
- RSI 오버소드 신호 ((RSI<=30): 시장 오버소드 반발 기회를 잡기 위해 사용됩니다.
- 쌍평평선 다목적 배열 ((SMA250>SMA500): 장기 상승 추세를 확인
- 거래량 확인 ((현 거래량> 20주기 거래량 평균선*2.5): 가격변동의 유효성을 검증
위의 세 가지 조건이 동시에 충족되면, 전략이 다중 상위 포지션에 진입한다. 평소 포지션 신호는 단기 평균선 아래에서 장기 평균선 ((죽은 포크) 을 통과하는 것으로 촉발된다. 동시에, 전략은 5%의 스톱로스를 설정하여 위험을 통제한다.
전략적 이점
- 복수의 확인 메커니즘은 가짜 신호를 감소시킵니다: RSI, 평균선 및 거래량과 결합된 3중 필터링은 거래 신호의 신뢰성을 크게 향상시킵니다.
- 트렌드 따라하는 특성: 장기 평균을 통해 큰 트렌드를 판단하고 역동적인 거래를 피하십시오.
- 리스크 제어: 고정된 스톱 리스를 설정하여 단일 거래의 위험을 효과적으로 제어
- 유연성: 전략의 매개 변수는 시장 특성에 따라 유연하게 조정할 수 있습니다.
- 거래 기회의 엄격한 선별: 여러 조건의 필터링으로 최적의 시점에만 진입할 수 있습니다.
전략적 위험
- 뒤떨어진 위험: 장기 주기 평균이 크게 뒤쳐져 있어 초기 추세를 놓칠 수 있다.
- 과도한 과잉 위험: 엄격한 다중 조건으로 인해 일부 효과적인 거래 기회가 놓쳐질 수 있습니다.
- 위축 시장 위험: 위축 시장에서 종종 잘못된 신호를 유발할 수 있습니다.
- 고정 비율의 손실은 모든 시장 환경에 적합하지 않을 수 있습니다.
- 매개변수 최적화 위험: 과도한 최적화로 인해 실제 거래에서 해당 전략의 성과가 저하될 수 있습니다.
전략 최적화 방향
- 동적 중지 최적화: ATR 또는 변동성에 기반한 동적 중지 메커니즘을 고려할 수 있습니다.
- 트렌드 강도 정량화: ADX와 같은 트렌드 강도 지표를 도입하여 트렌드 판단의 정확성을 향상시킵니다.
- 포지션 관리 최적화: 신호 강도 및 시장 변동률에 따라 포지션 비율을 동적으로 조정
- 출구 메커니즘의 개량: 수익 목표를 높이고 손실을 이동하는 등 유연한 출구 메커니즘
- 시간 필터: 거래 시간 필터를 추가하여 비효율적인 거래 시기를 피합니다.
요약하다
이것은 합리적이고 논리적으로 엄격한 트렌드 추적 전략을 설계하고, 여러 기술 지표의 조합을 통해 수익과 위험을 효과적으로 균형 잡는다. 전략의 핵심 장점은 완벽한 신호 확인 장치와 위험 제어 시스템이지만, 과잉 과잉과 지연성 등의 과제에 직면하고 있다. 제안된 최적화 방향으로 전략은 실제 응용에서 더 나은 성능을 얻을 수 있다.
Source
Pine
/*backtest
start: 2019-12-23 08:00:00
end: 2024-11-27 00:00:00
period: 1d
basePeriod: 1d
exchanges: [{"eid":"Futures_Binance","currency":"BTC_USDT"}]
*/


// This work is licensed under a Attribution-NonCommercial-ShareAlike 4.0 International (CC BY-NC-SA 4.0) https://creativecommons.org/licenses/by-nc-sa/4.0/
// © wielkieef
Strategy parameters
Related strategies
Comment
All comments (0)
No data
- 1