
1
Follow
1780
Followers
개요
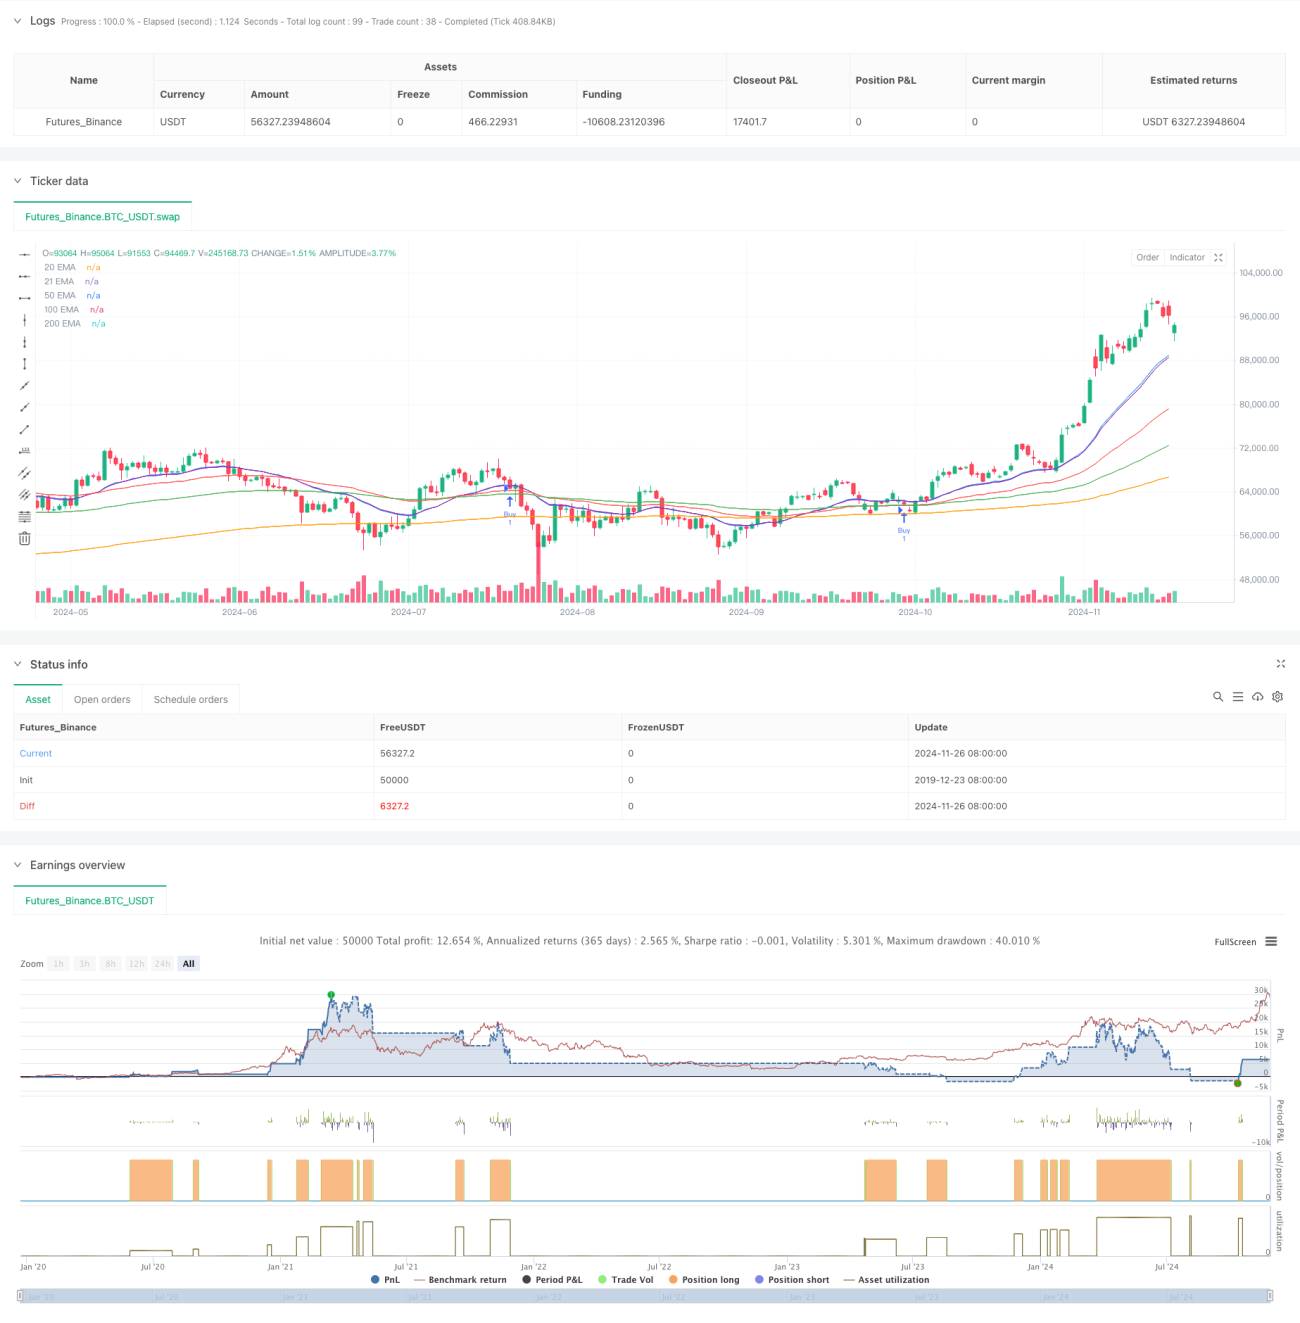
이 전략은 다중 지수 이동 평균 ((EMA) 와 실제 파도 지표 ((ATR) 를 기반으로 한 트렌드 추적 거래 시스템이다. 전략은 여러 평행선의 배열 형태를 판단하여 트렌드 방향을 확인하고, 상승 추세에서 역전 구매 기회를 찾고, ATR 동력을 사용하여 중지 손실 및 수익 목표를 설정한다. 이 방법은 트렌드 추적의 안정성을 보장하고, ATR을 통해 시장의 변동에 대한 동적 적응을 구현한다.
전략 원칙
전략의 핵심 논리에는 다음과 같은 핵심 요소가 포함됩니다.
- 추세 판단: 20, 50, 100, 200일 지수 이동 평균을 사용하여, 단기 평균선이 장기 평균선 위에 있고 다목적 배열을 나타낼 때 상승 추세를 확인한다.
- 진입 조건: 확인된 트렌드를 바탕으로 21일 평균선 근처에 가격조정을 기다리는 동안 진입한다.
- 위험 관리: ATR을 기반으로 설정된 다이내믹 스톱로스 및 수익 목표, 스톱로스 설정된 입시 가격에 ATR을 1.5배 빼고, 수익 목표가 입시 가격에 ATR을 3.5배 더한다.
- 포지션 관리: 단일 포지션 모드를 적용하여 포지션을 보유 할 때 재입입이 없습니다.
전략적 이점
- 트렌드 확인 메커니즘은 엄격하다: 여러 개의 평균 선의 배열을 통해 트렌드를 확인하여 가짜 돌파구를 효과적으로 필터링 할 수 있다.
- 진입 시점 정확성: 상승 추세에서 평균선 지지대에 회환을 기다리는 진입, 승률을 높였다.
- 리스크 관리의 유연성: ATR의 동적 설정으로 시장의 변동성에 따라 자동으로 조정할 수 있는 중지 손실 및 수익 목표.
- 실행 논리 명확성: 전략 규칙이 명확하고, 이해하기 쉽고, 실행하기 쉽다.
- 적응력: 다양한 시장 환경과 거래 품종에 적용할 수 있다.
전략적 위험
- 흔들림 시장 위험: 가로판 흔들림 시장에서 자주 중지 손실을 유발할 수 있습니다.
- 슬리피지 위험: 시장이 격렬하게 변동할 경우 큰 슬리피지에 직면할 수 있습니다.
- 트렌드 반전 위험: 트렌드 반전 시 큰 회전이 발생할 수 있다.
- 매개 변수 민감성: 평균선 주기 및 ATR 배수의 선택은 전략의 성능에 중요한 영향을 미칩니다.
전략 최적화 방향
- 시장 환경 필터를 추가합니다: ADX와 같은 트렌드 강도 지표를 추가하여 강력한 트렌드 시장에서 거래 할 수 있습니다.
- 포지션 관리를 최적화: 트렌드 강도에 따라 포지션 규모를 동적으로 조정할 수 있다.
- 개선된 손해 차단 장치: 지대 위치 설정과 결합하여 손해 차단을 추적할 수 있다.
- 출전 메커니즘을 추가합니다: 트렌드 리버스 신호를 추가할 수 있습니다
- 매개 변수 자기 적응: 시장의 변동 주기 역학에 따라 평균선 매개 변수를 조정할 수 있다.
요약하다
이것은 구조적이고 논리적으로 엄격한 트렌드 추적 전략이다. 다중 평균선 확인 트렌드, 회전 입점 및 ATR 동적 위험 관리의 조합으로 전략의 안정성을 보장하고, 좋은 적응력을 갖추고 있다. 일부 고유한 위험이 있지만, 제안된 최적화 방향은 전략의 안정성과 수익성을 더욱 향상시킬 수 있다. 이 전략은 중장기 트렌드를 추적하는 데 특히 적합하며, 트렌드 시장에서 안정적인 수익을 기대하는 거래자에게는 좋은 선택이다.
Source
Pine
Related strategies
Comment
All comments (0)
No data
- 1