볼린저 밴드와 상대 강도 조합 거래 전략

개요
이 전략은 볼링거 밴드 (Bollinger Bands) 와 상대적으로 약한 지표 (RSI) 를 결합하여 두 가지의 고전적인 기술 지표를 결합하여 완전한 거래 시스템을 형성합니다. 전략은 주로 시장의 변동성과 동력의 변화를 포착하여 거래 기회를 찾으며, 특히 일일 거래자의 사용에 적합합니다. 볼링을 통해 시장의 변동성을 측정하면서 RSI 지표와 함께 가격의 과매 과매 상태를 확인하여 더 신뢰할 수있는 거래 신호를 생성합니다.
전략 원칙
이 전략의 핵심 논리는 가격 변동성 지표와 동력 지표를 결합하는 것입니다. 폴린 띠는 20 일 간소 이동 평균을 중간 궤도로 삼고, 상하 궤도는 중간 궤도와 2.5 배의 표준 차이를 줄입니다. 가격이 하향 궤도를 건드리고 RSI가 30보다 낮으면 시스템이 여러 신호를 냅니다. 가격이 궤도를 돌파하고 RSI가 70보다 높으면 시스템이 평소 신호를 냅니다.
전략적 이점
- 높은 신호 신뢰성: 두 가지 다른 차원의 기술 지표를 결합하여 거래 신호의 신뢰성을 크게 향상시킵니다.
- 위험 통제: 명확한 입출장 조건이 감정적 거래의 영향을 줄여줍니다.
- 유연성: 전략의 매개 변수는 시장 상황에 따라 유연하게 조정됩니다.
- 명확한 운영 논리: 거래 규칙이 명확하고 실행 및 추적하기 쉽습니다.
- 합리적인 리스크/이익 비율: 합리적인 스톱-스트로드 조건을 설정하여 좋은 리스크/이익 비율을 보장합니다.
전략적 위험
- 불안정 시장 위험: 시장의 극심한 변동으로 인해 잘못된 신호가 발생할 수 있습니다.
- 트렌드 시장의 위험: 강한 트렌드 시장에서 일부 시장을 놓칠 수 있습니다.
- 매개 변수 민감성: 정책 효과는 매개 변수 설정에 민감하며, 지속적인 최적화가 필요합니다.
- 슬라이드 효과: 유동성이 낮은 시장에서 더 큰 슬라이드를 직면 할 수 있습니다.
- 체계적 위험: 시장의 갑작스러운 현상이 전략의 실패로 이어질 수 있다.
전략 최적화 방향
- 동적 변수 최적화: 시장의 변동률에 따라 동적으로 조정되는 폴린 대역의 변수를 고려할 수 있다
- 트렌드 필터를 추가: 트렌드 판단 지표를 도입하여 강력한 트렌드 시장에서 잘못된 신호를 피하십시오.
- 손해 방지 제도를 개선: 더 유연한 손해 방지 전략을 설계하고 자금 사용 효율성을 높여라
- 최적화된 신호 확인: 트래픽을 증가시키는 등 보조 지표로 신호 신뢰성을 높인다.
- 매매 전략 개선: 더 세밀한 수익 목표와 중지 조건 설계
요약하다
이 전략은 폴린 밴드와 RSI 지표를巧妙하게 결합하여 논리적으로 엄격하고 동작성이 강한 거래 시스템을 구축한다. 전략의 주요 장점은 신호의 신뢰성이 높고, 위험 통제가 완벽하며, 강한 적응력을 가지고 있다. 특정 시장 환경에서 몇 가지 도전이 있을 수 있지만, 지속적인 최적화 및 개선으로 전략의 전체적인 성능은 여전히 좋은 응용 가치가 있다.
Overview
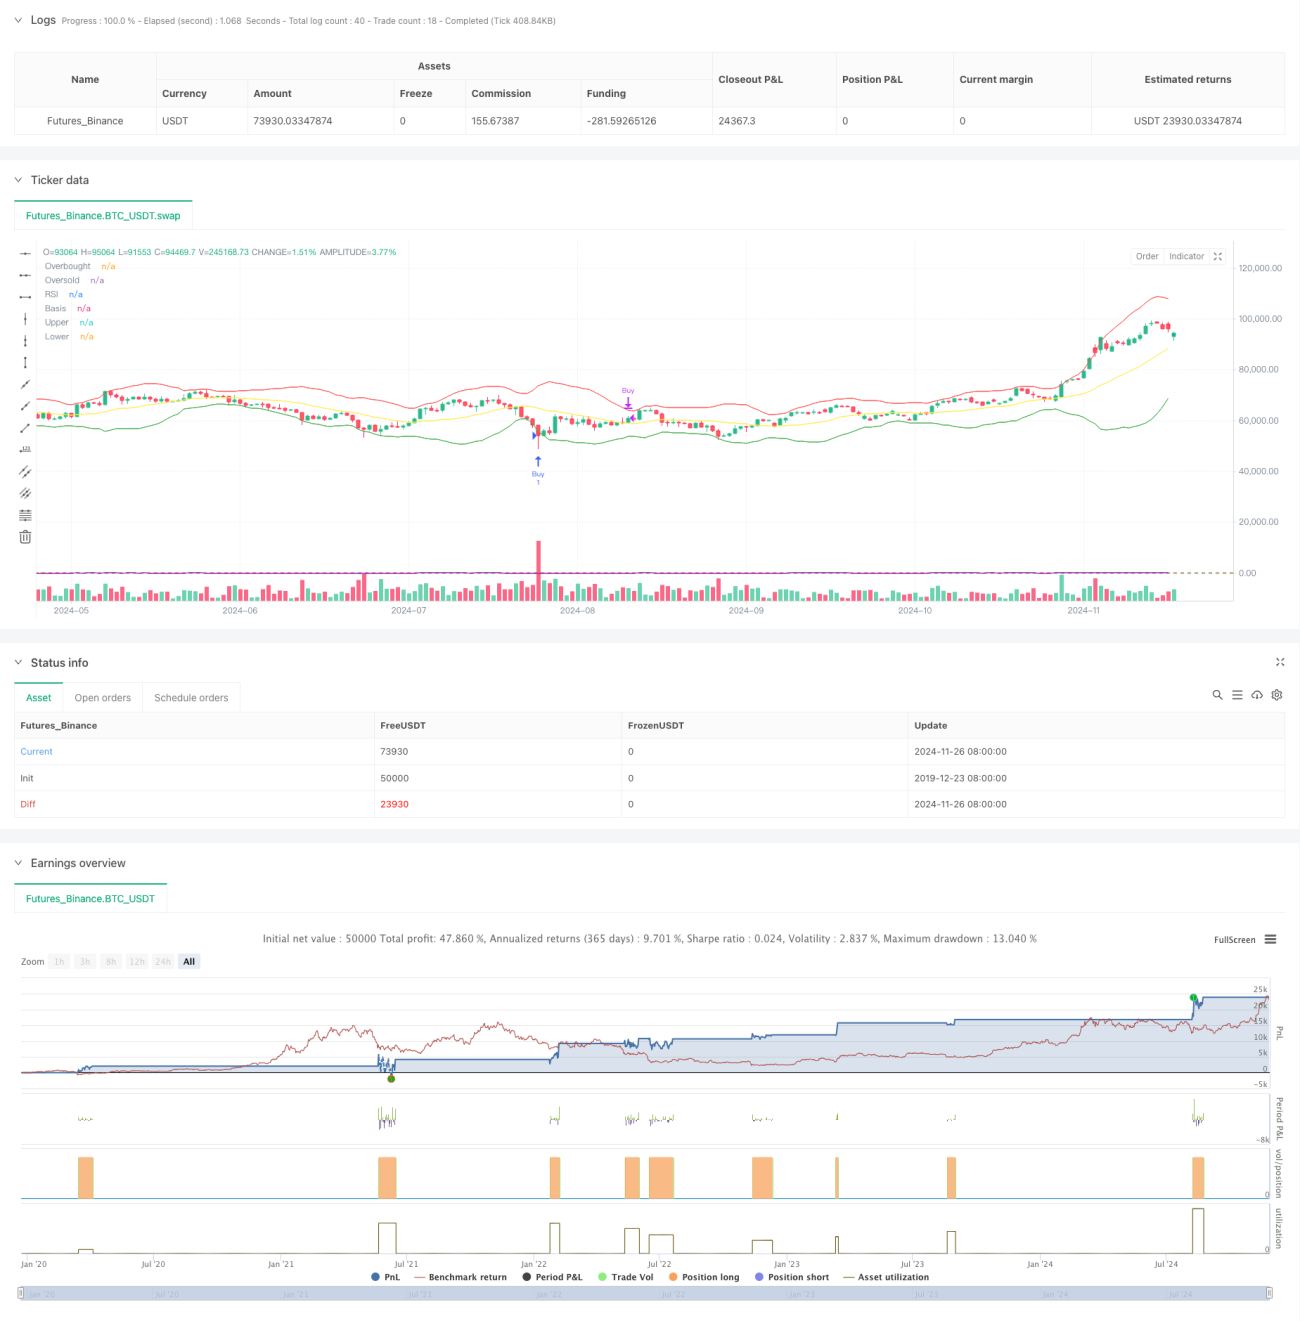
This strategy combines Bollinger Bands and Relative Strength Index (RSI) to form a comprehensive trading system. It primarily seeks trading opportunities by capturing market volatility and momentum changes, particularly suitable for intraday traders. The strategy uses Bollinger Bands to measure market volatility while incorporating RSI to confirm overbought and oversold conditions, generating more reliable trading signals.
Strategy Principles
The core logic combines volatility and momentum indicators. Bollinger Bands consist of a 20-day simple moving average as the middle band, with upper and lower bands set at 2.5 standard deviations. Buy signals are generated when price touches the lower band and RSI is below 30, while exit signals occur when price breaks above the upper band and RSI exceeds 70. Additionally, the strategy includes an extra exit condition when RSI rises above 50, helping to secure profits. The design thoroughly considers market volatility characteristics and price momentum patterns.
Strategy Advantages
- High Signal Reliability: Combining two different technical indicators significantly improves trading signal reliability
- Comprehensive Risk Control: Clear entry and exit conditions effectively reduce emotional trading
- Strong Adaptability: Strategy parameters can be flexibly adjusted for different market conditions
- Clear Operational Logic: Trading rules are explicit, easy to execute and backtest
- Reasonable Risk-Reward Ratio: Appropriate profit-taking and stop-loss conditions ensure a favorable risk-reward ratio
Strategy Risks
- Choppy Market Risk: May generate false signals in highly volatile market conditions
- Trend Market Risk: Might miss some opportunities in strong trending markets
- Parameter Sensitivity: Strategy performance is sensitive to parameter settings, requiring continuous optimization
- Slippage Impact: May face significant slippage in markets with poor liquidity
- Systematic Risk: Market emergencies may cause strategy failure
Strategy Optimization Directions
- Dynamic Parameter Optimization: Consider dynamically adjusting Bollinger Bands parameters based on market volatility
- Add Trend Filters: Introduce trend identification indicators to avoid false signals in strong trending markets
- Improve Stop Loss Mechanism: Design more flexible stop-loss strategies to enhance capital efficiency
- Optimize Signal Confirmation: Add volume and other auxiliary indicators to improve signal reliability
- Enhance Exit Strategy: Design more detailed profit targets and stop-loss conditions
Summary
The strategy cleverly combines Bollinger Bands and RSI indicators to build a logically rigorous and highly operable trading system. Its main advantages lie in high signal reliability and comprehensive risk control, while maintaining strong adaptability. Although it may face challenges in certain market environments, the strategy maintains good practical value through continuous optimization and improvement. Traders should pay attention to changing market conditions, flexibly adjust strategy parameters, and always maintain proper risk control in practical applications.
- 1