
개요
이 전략은 기술 분석의 고전적인 평행선 교차와 K선 형태 인식을 결합한 지능형 거래 시스템이다. 전략은 K선의 상하의 선과 실체와의 관계를 분석하여 쌍평행선 교차 신호를 결합하여 시장 추세 전환점을 정확하게 포착한다. 시스템은 가격 움직임을 관찰하는 것뿐만 아니라 평균 파장을 계산하여 거래 매개 변수를 동적으로 조정하여 전략의 적합성을 향상시킨다.
전략 원칙
이 전략의 핵심 논리는 크게 두 가지로 나뉘어져 있습니다.
-
K선 형태 인식 모듈은 위아래 그림선과 개체의 비율 관계를 계산하여 잠재적인 역전 신호를 식별한다. 시스템은 조정 가능한 그림선 곱하기 파라미터 (wickMultiplier) 와 개체 비율 파라미터 (bodyPercentage) 를 신호 품질을 최적화하기 위해 설정한다. K선에서 조건에 부합하는 긴 위아래 그림선 또는 긴 아래 그림선이 나타나면, 시스템은 그에 따른 더하거나 공백 신호를 낸다.
-
쌍평선 교차 시스템은 14주기 및 28주기 간단한 이동 평균 ((SMA) 을 트렌드 지표로 사용합니다. 단기평선이 장기평선을 상향으로 가로질렀을 때, 시스템은 다중 신호를 생성합니다. 단기평선이 장기평선을 하향으로 가로질렀을 때, 시스템은 공백 신호를 생성합니다.
전략적 이점
- 신호 필터링 엄격함: 그림자 선 배수 및 실물 퍼센트 <unk>값을 설정하여 낮은 품질의 신호를 효과적으로 필터링함
- 변수 조정: 다양한 시장 환경에 따라 최적화 전략을 수행하기 위해 유연한 변수 조정 인터페이스를 제공합니다.
- 트렌드 추적과 반전 신호 결합: 트렌드 상황을 파악하면서 중요한 반전 기회를 놓치지 마십시오.
- 리스크 제어: 50 주기의 평균 파장을 계산하여 거래 매개 변수를 동적으로 조정하여 전략의 안정성을 향상시킵니다.
전략적 위험
- 변수 민감성: 다른 변수 설정으로 인해 전략 성능에 큰 차이가 발생할 수 있으며 충분한 변수 최적화가 필요합니다.
- 시장 환경 의존성: 불안정한 시장에서 과도한 가짜 신호가 발생하여 거래 비용이 증가할 수 있습니다.
- 슬라이드 효과: 유동성이 낮은 시장에서 더 큰 슬라이드 위험에 직면 할 수 있습니다.
- 신호 지연: 평선 시스템에는 약간의 지연성이 있으며, 최적의 출입 시기를 놓칠 수 있다.
전략 최적화 방향
- 트래픽 지표 도입: 트래픽 변화를 분석하여 역전 신호의 유효성을 확인
- 최적화 변수 동적 조정 메커니즘: 시장의 변동에 따라 그림자 선 배수와 실물 비율 변수를 자동으로 조정
- 트렌드 강도를 높이는 필터링: RSI 또는 ADX와 같은 지표와 결합하여 약한 시장의 신호를 필터링하십시오.
- 손해 차단 메커니즘: ATR 지표에 기반한 동적 손해 차단 위치를 설계하여 위험 제어의 정확성을 향상시킵니다.
요약하다
이 전략은 K선 형태 인식과 균등선 교차 시스템을 결합하여 비교적 완전한 거래 의사 결정 프레임워크를 구축한다. 이 전략의 장점은 엄격한 신호 필터링 메커니즘과 유연한 파라미터 조정 능력이지만, 동시에 파라미터 최적화 및 시장 환경 적응성의 문제에 주의를 기울여야 한다. 지속적인 최적화 및 개선으로 이 전략은 다양한 시장 환경에서 안정적인 성능을 유지할 수 있을 것으로 보인다.
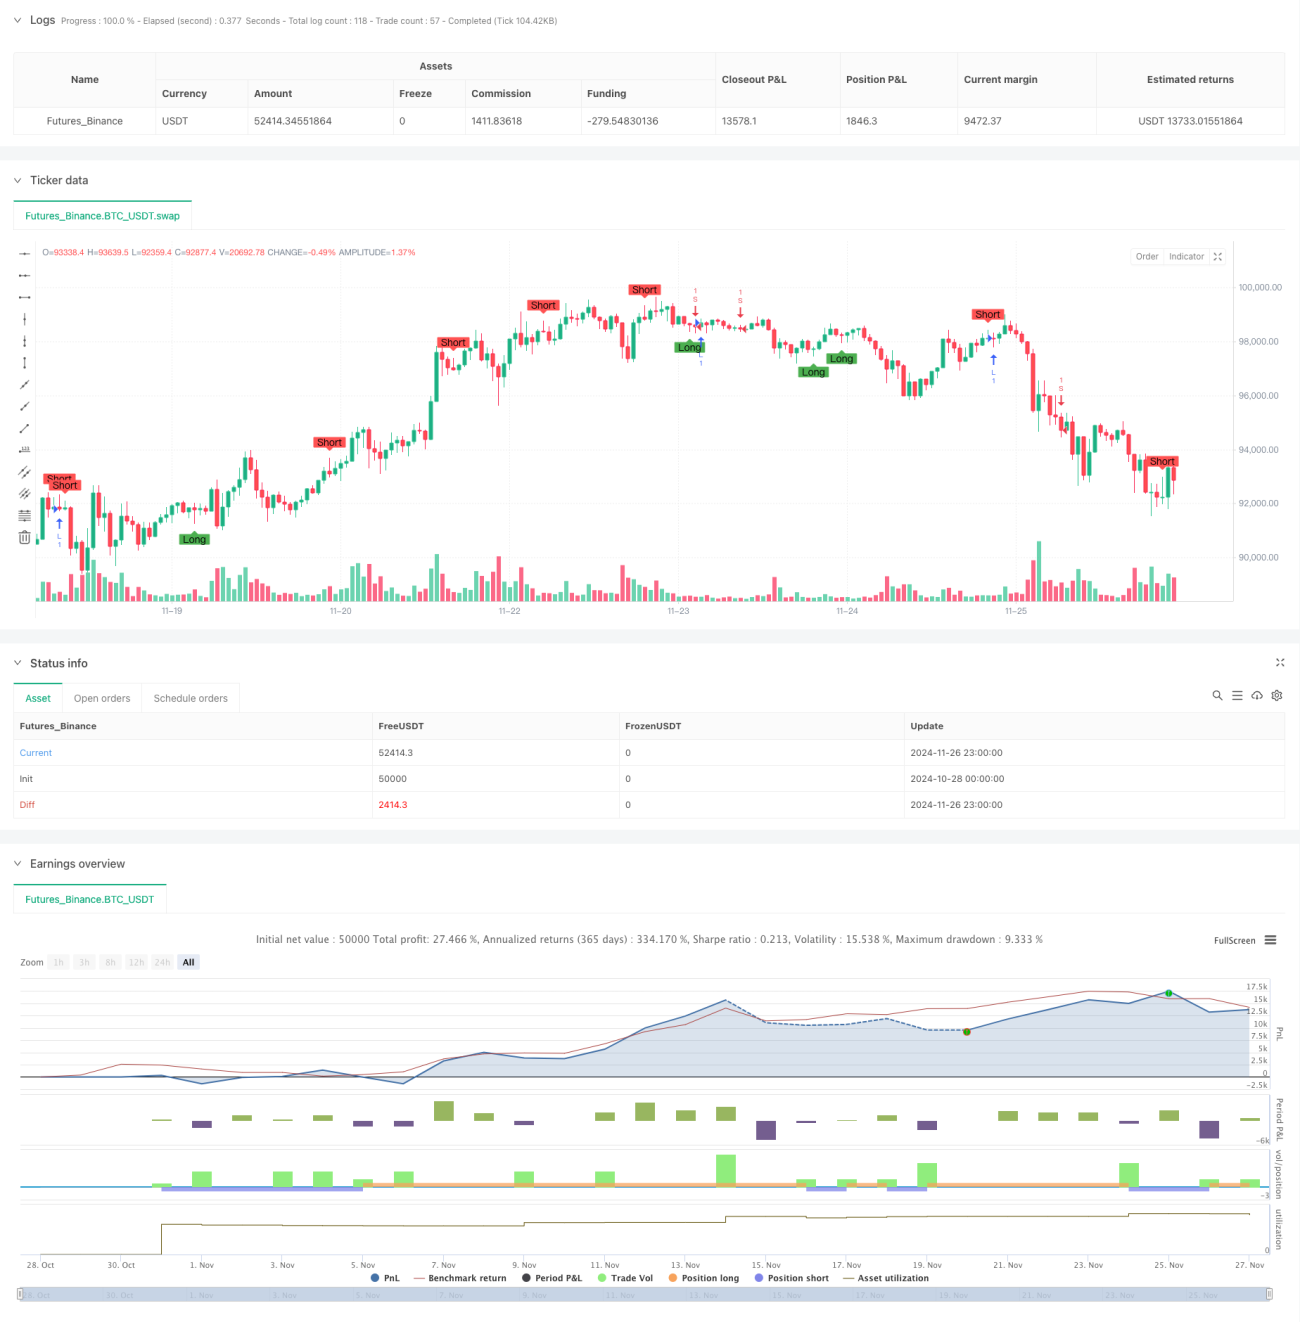
/*backtest
start: 2024-10-28 00:00:00
end: 2024-11-27 00:00:00
period: 1h
basePeriod: 1h
exchanges: [{"eid":"Futures_Binance","currency":"BTC_USDT"}]
*/

//@version=5 indicator("Wick Reversal Setup", overlay=true)

// Input parameters
wickMultiplier = input.float(3.5, title="Wick Multiplier", minval=0.5, maxval=20)- 1