
1
Follow
1780
Followers
개요
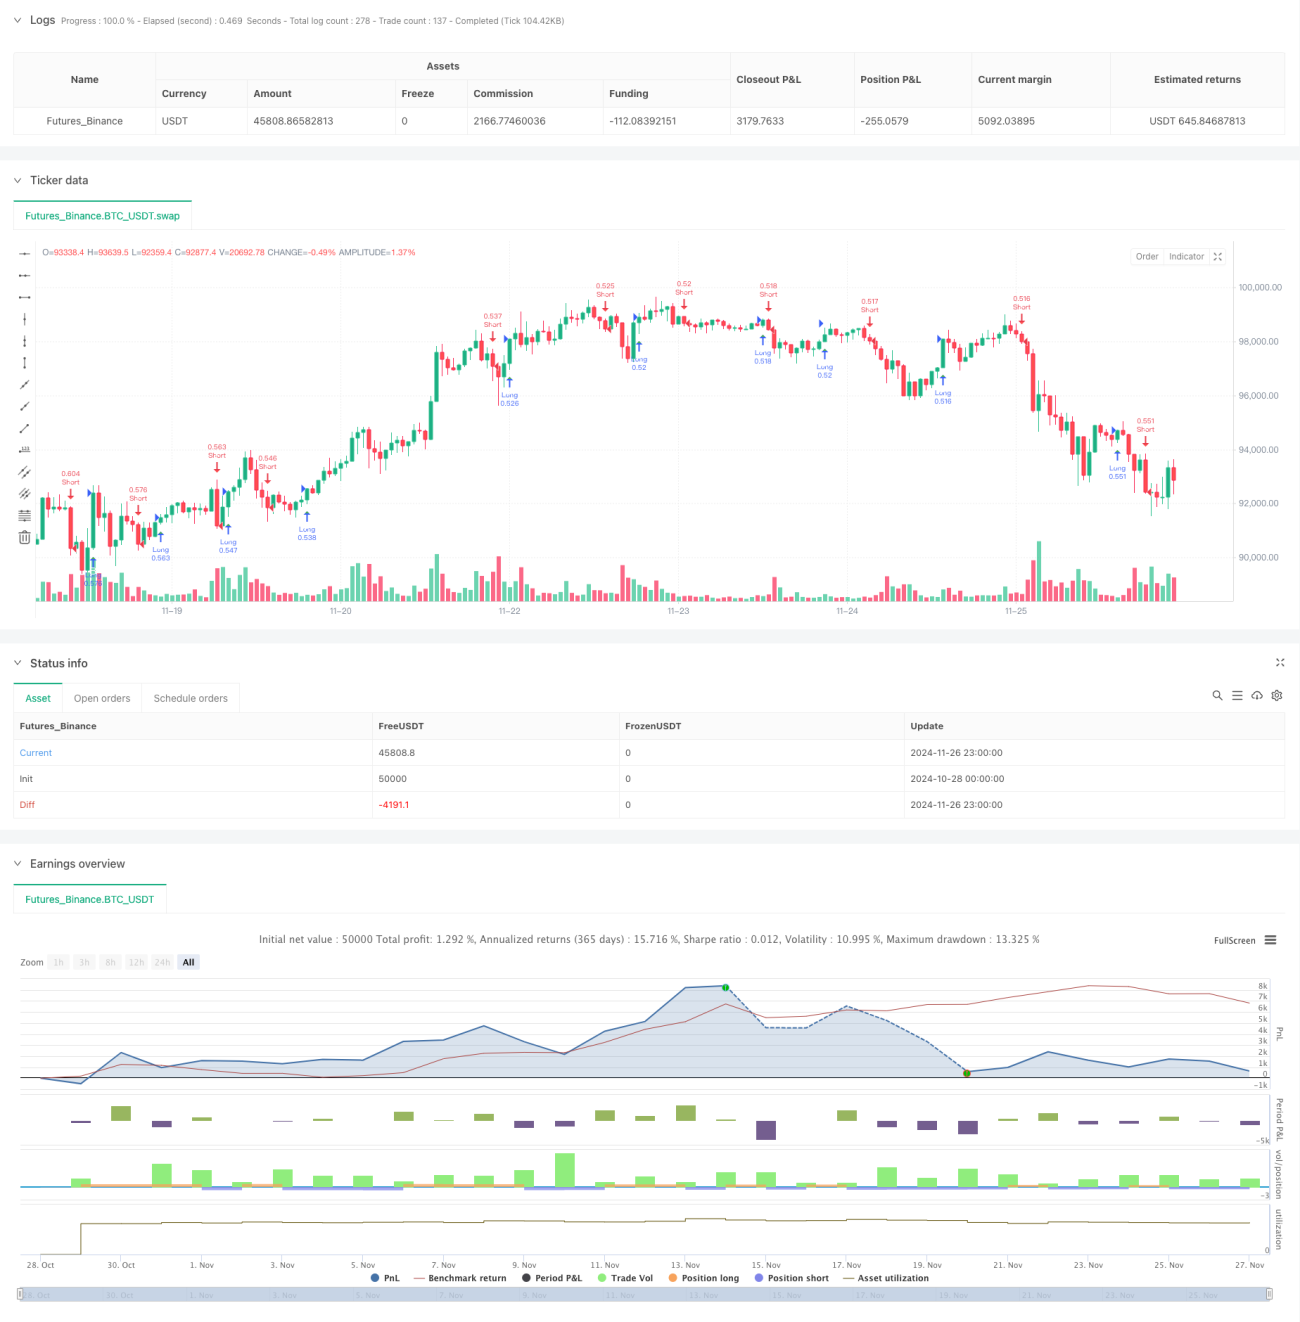
이것은 변동률과 윌리엄스 퍼센트 레인지 (Williams Percent Range) 를 결합한 자기 적응 트렌드 추적 전략이다. 이 전략은 가격 변동 범위와 사용자 정의 카운터를 계산하여 트렌드 판단의 민감도를 조정하여 다른 시장 환경에서 더 나은 적응을 이룬다. 전략의 핵심은 가격 변동의 폭을 관찰하여 윌리엄스 레인지의 매개 변수를 동적으로 조정하여 시장 트렌드의 전환점을 더 정확하게 포착하는 것이다.
전략 원칙
전략은 먼저 한 주기의 가격 변동 범위 (Range) 와 이동 평균 (AvgRange) 을 계산한다. 실시간 가격 변화와 평균 변동 범위의 관계를 비교하여 두 개의 카운터 (TrueCount와 TrueCount2) 를 구축하여 눈에 띄는 변동의 발생 빈도를 기록한다. 이 카운터는 윌리엄스 지표의 계산 파라미터를 동적으로 조정하기 위해 사용되며, 전략은 시장 변동 상태에 따라 자동으로 민감도를 조정할 수 있다. 조정된 윌리엄스 지표 값이 예상된 상하를 돌파하면 전략은 그에 따른 구매 또는 판매 신호를 발생시킨다.
전략적 이점
- 자기 적응력 - 변동률 자기 적응 메커니즘을 통해 전략은 다양한 시장 환경에서 안정적인 성과를 유지할 수 있습니다.
- 리스크 제어 - 내장된 리스크 매개 변수 RISK, 거래자가 자신의 리스크 취향에 따라 전략의 급격성을 조정할 수 있도록
- 신호 명확성 - 명확한 브레이크 신호 메커니즘을 사용하여 가짜 신호를 피하십시오.
- 확장성 - 정책 프레임워크는 최적화를 위해 다른 기술 지표를 도입할 수 있습니다.
- 컴퓨팅 효율성 - 간단한 계산 방법을 사용하여 실시간 거래에 적합합니다.
전략적 위험
- 매개 변수 민감성 - ASClength 및 RISK 매개 변수의 선택은 정책 성능에 중대한 영향을 미칩니다.
- 시장 환경 의존성 - 불안한 시장에서 과도한 거래 신호가 발생할 수 있습니다.
- 뒤떨어진 상태 - 이동 평균을 사용하면 입지와 출전이 지연될 수 있다.
- 가짜 돌파구 - 높은 변동기에 가짜 신호가 발생할 수 있다
최적화 매개 변수를 재검토하고 다른 확인 지표와 결합하여 위험을 줄이는 것이 좋습니다.
전략 최적화 방향
- 거래량 지표 도입 - 거래량으로 트렌드 변화의 효과를 확인
- 최적화된 카운터 논리 - 시장의 변동을 평가하기 위해 더 복잡한 통계 방법을 사용할 수 있습니다.
- 추가된 스톱 메커니즘 - 위험을 더 잘 제어하기 위해 다이내믹 스톱을 도입하는 것이 좋습니다.
- 시장 환경 필터 - 부적절한 시장 조건에서 거래를 피하기 위해 시장 환경 판단 모듈을 추가합니다.
- 매개 변수 적응 - 매개 변수 자동 최적화 메커니즘을 개발하여 전략 적응력을 향상시킵니다.
요약하다
이것은 변동률 분석과 트렌드 추적을 결합한 혁신적인 전략이며, 적응 메커니즘을 통해 전략의 안정성과 신뢰성을 향상시킵니다. 일부 고유한 위험이 있지만, 합리적인 매개 변수 설정과 최적화 방향을 구현하면 다양한 시장 환경에서 안정적인 성능을 유지할 수 있습니다. 전략의 프레임워크 디자인은 추가 확장 및 최적화를 허용하며, 좋은 발전 잠재력을 가지고 있습니다.
Source
Pine
/*backtest
start: 2024-10-28 00:00:00
end: 2024-11-27 00:00:00
period: 1h
basePeriod: 1h
exchanges: [{"eid":"Futures_Binance","currency":"BTC_USDT"}]
*/

//@version=5
strategy("ASCTrend", shorttitle="ASCTrend", overlay=true, default_qty_type=strategy.percent_of_equity, default_qty_value=100)

eternalfg = input(false, title="eternal 確定")Strategy parameters
Related strategies
Comment
All comments (0)
No data
- 1