
1
Follow
1781
Followers
개요
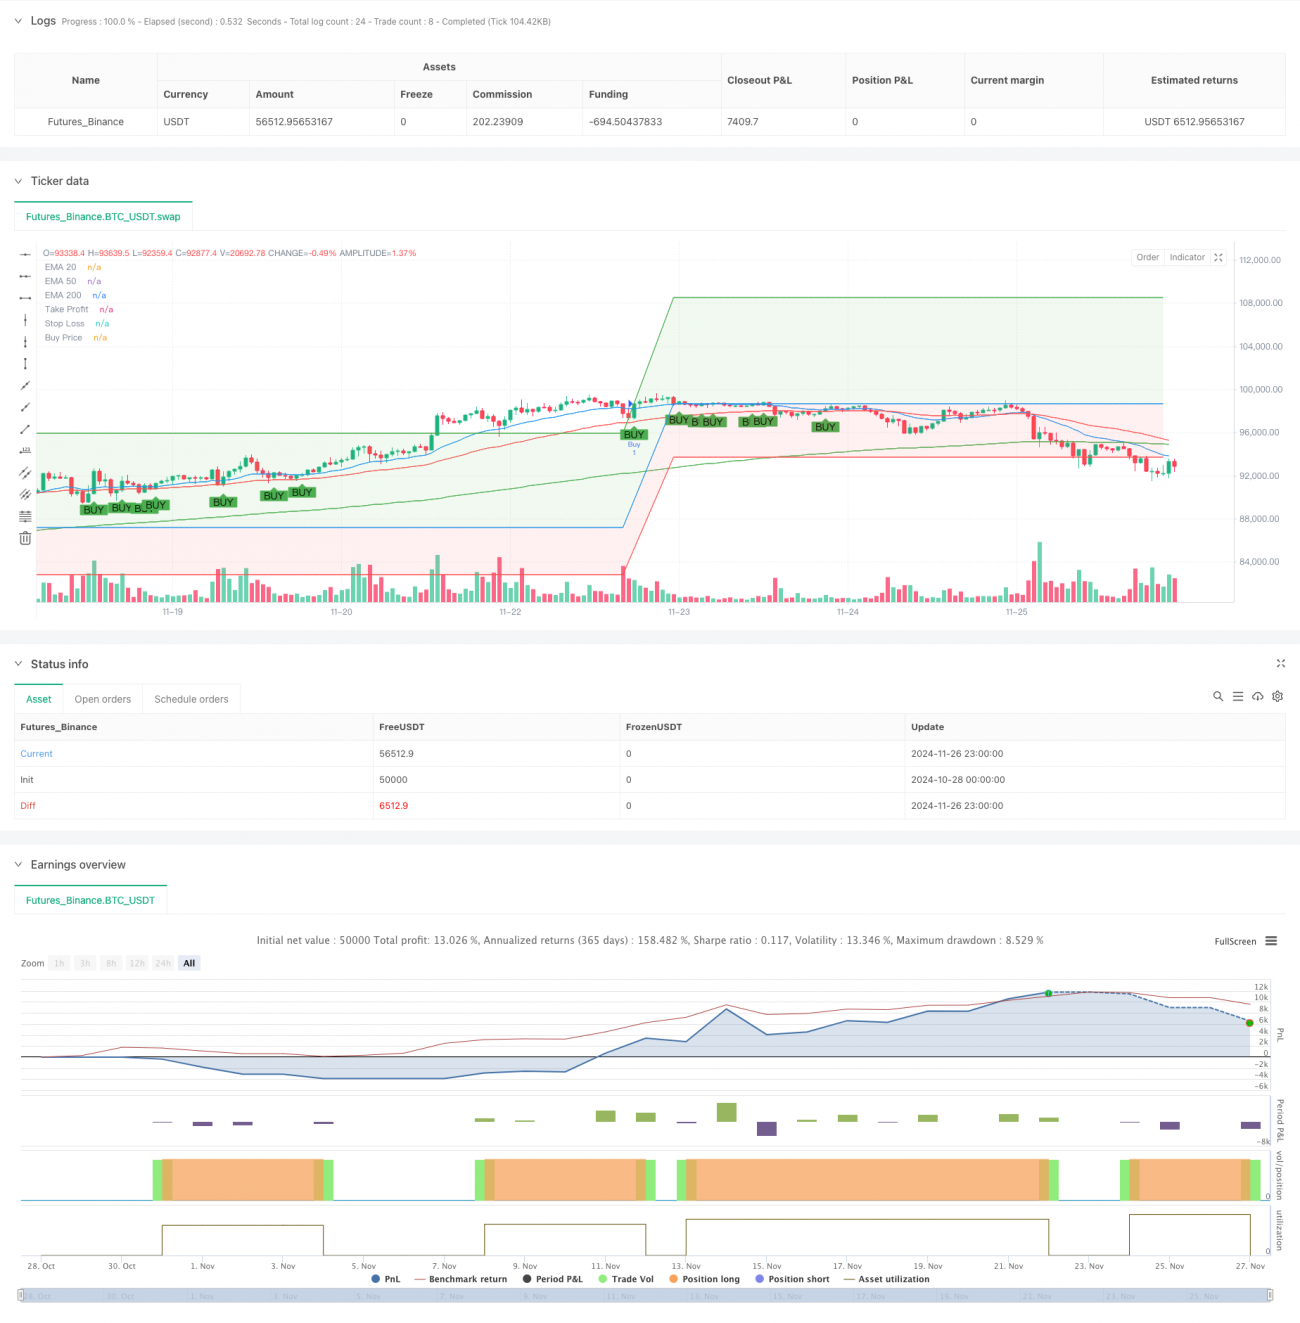
이 전략은 주로 20·50 및 200 주기 지수 이동 평균 ((EMA) 의 교차 관계와 가격과 평균의 관계를 기반으로 진입 시기를 판단하며, 백분율 기반의 중지 손실을 설정하여 위험을 제어합니다. 이 전략은 특히 1 시간, 일간 및 주간 차트와 같은 더 큰 시간 기간에 적합하며, 중기 및 장기적인 추세를 효과적으로 포착합니다.
전략 원칙
이 전략의 핵심 논리는 다중평평선 시스템과 가격행동 분석에 기초한다:
- 세 개의 다른 주기 ((20, 50, 200) 의 지수 이동 평균을 사용하여 트렌드 판단 시스템을 구축
- 입학 조건은 다음의 모든 조건을 충족해야 합니다.
- 20주기 EMA 상위에서 거래소 개시 및 종료
- 20주기 EMA는 50주기 EMA 위에 있습니다.
- 50주기 EMA는 200주기 EMA 위에 있습니다.
- 위험 통제는 일정한 비율로 이루어집니다.
- 입점 가격보다 10% 높은 가격으로 정지
- 입점 가격의 5% 아래로 스톱로스 설정
전략적 이점
- 다중 인증 메커니즘의 신뢰성 향상
- 트리플 평균선과 가격 돌파를 통해 다중 검증을 제공합니다.
- 가짜 신호 방해를 피하십시오.
- 좋은 위험 관리 시스템
- 미리 설정된 스톱포드 스톱포드 위치
- 위험과 이익의 합리적 비율 (~1:2)
- 매우 적응력이 좋다
- 여러 시간 사이클에 적용할 수 있습니다.
- 중장기 트렌드 거래에 특히 적합합니다.
전략적 위험
- 수평상황은 좋지 않다.
- 시장의 흔들림으로 인해 자주 손실이 발생할 수 있습니다.
- 트렌드가 뚜렷할 때 사용하는 것이 좋습니다.
- 지연 위험
- 평선 시스템은 다소 뒤떨어져 있습니다.
- "아, 정말 멋져요.
- 고정 스톱 손실 제한
- 고정된 비율은 모든 시장 환경에 적합하지 않을 수 있습니다.
- 변동율에 따라 조정하는 것이 좋습니다.
전략 최적화 방향
- 변동성 지표 소개
- ATR을 사용하여 동적으로 정지 손실을 조정합니다.
- 전략의 시장 적응성을 높여라
- 트렌드 강도 필터링
- 트렌드 강도 지표를 추가합니다.
- 입구 신호의 질을 높여라
- 평균 회로 최적화
- 다른 시장 특성에 따라 평균 선 변수를 조정
- 변수 최적화 범위를 제안
요약하다
이것은 합리적이고 논리적으로 명확하게 설계된 트렌드 추적 전략이다. 다중 기술 지표의 조합 사용으로 전략의 신뢰성을 보장하고 명확한 위험 제어 프로그램을 제공합니다. 전략은 특히 대주기 차트에서 작동하기에 적합하며 중기 및 중기 경향을 파악하는 데 독특한 이점이 있습니다. 제안된 최적화 방향에 의해 전략은 추가적으로 향상된다. 상인은 실제 사용 전에 피드백 시스템에서 충분히 테스트하고 특정 거래 품종의 특성에 따라 파라미터를 적절히 조정하는 것이 좋습니다.
Source
Pine
Related strategies
Comment
All comments (0)
No data
- 1