
1
Follow
1781
Followers
개요
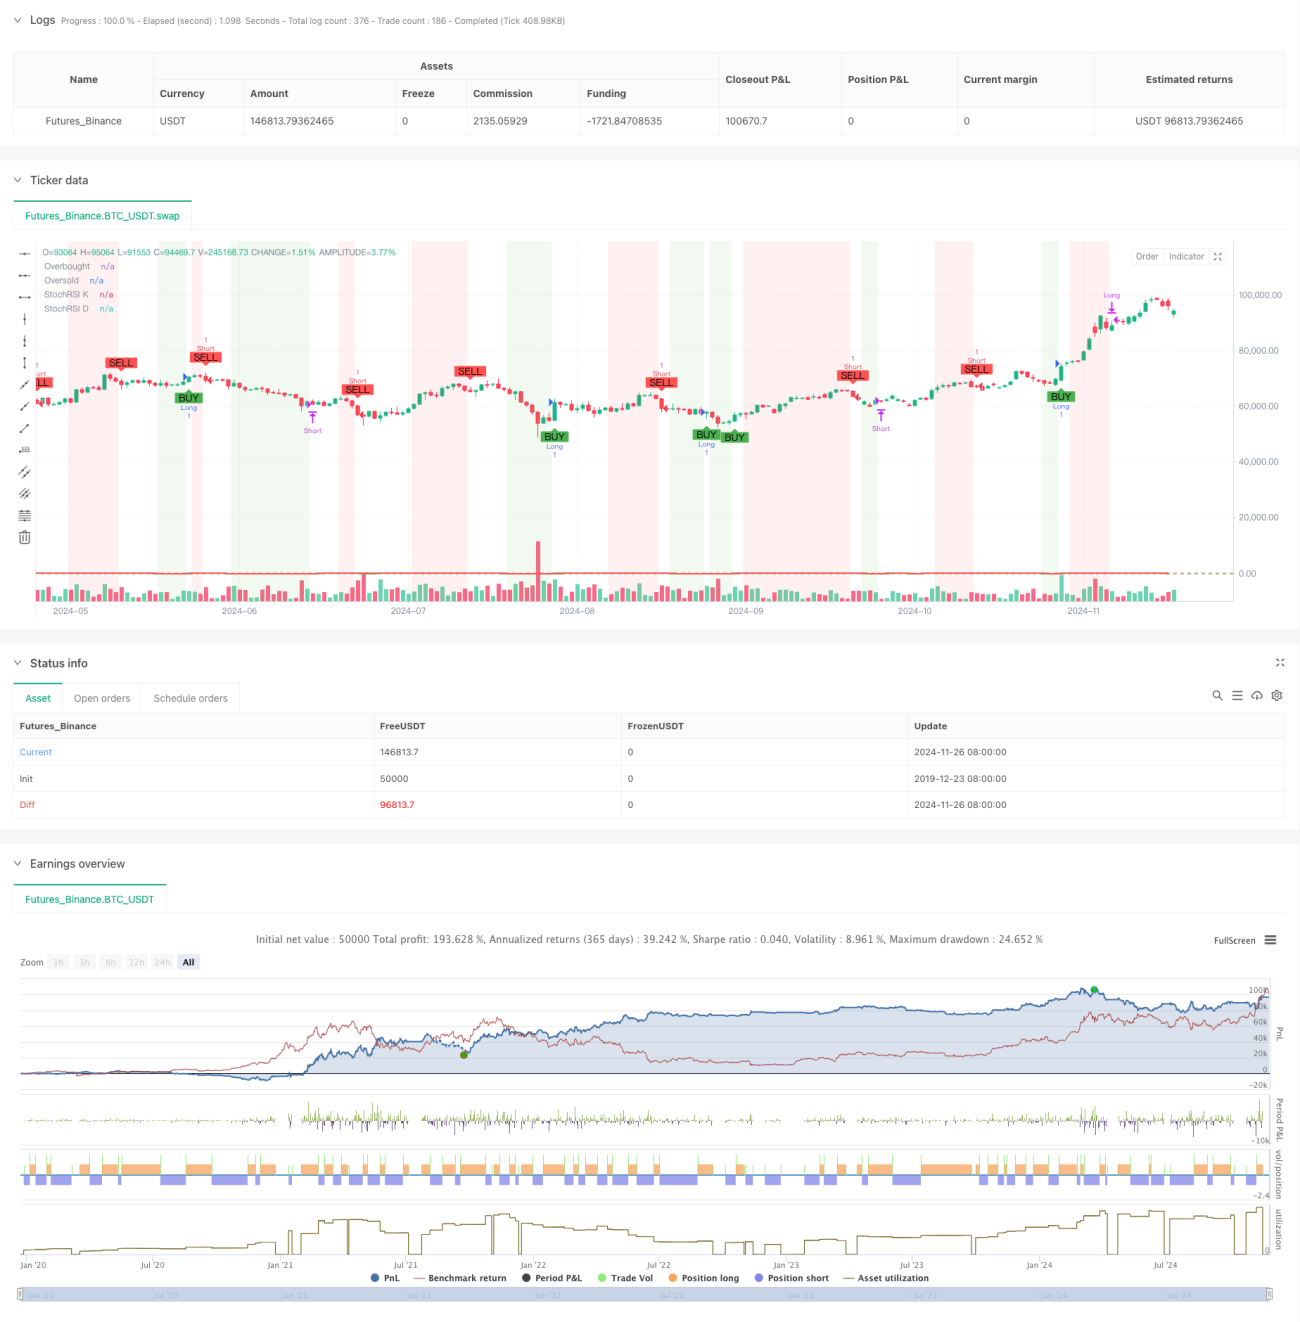
이 전략은 무작위적으로 비교적 약한 지수 ((Stochastic RSI) 와 <unk> 그래프 형태를 결합한 복합적인 거래 시스템이다. 시스템은 SRSI 지표의 오버 바이 오버 셀 레벨을 분석하여 가격 움직임의 <unk> 그래프를 확인하고, 완전히 자동화된 거래 신호 생성을 구현한다. 전략은 첨단 기술 지표 조합 방법을 채택하고, 트렌드 추적과 역전 거래의 특성을 결합하여 강력한 시장 적응력을 가지고 있다.
전략 원칙
전략의 핵심 논리는 다음과 같은 핵심 요소에 기초합니다.
- 14 주기의 RSI를 기본으로 사용하여, 임의의 RSI 값을 계산하여 주요 신호 소스를 형성합니다.
- 무작위 RSI의 K선과 D선을 3주기의 간단한 이동 평균으로 설정하여 평형 신호를 사용한다
- 80과 20을 시장 상태를 판단하기 위해 과매매의 절벽으로 설정합니다.
- 시장의 방향을 확인하기 위해 현재 <unk> 도표의 오픈 가격과 클로즈 가격 관계를 결합
- K 선이 상향으로 오버셀 레벨을 통과하고 항선이 나타나면 다중 신호가 트리거됩니다.
- K 선이 상향으로 오버 바이 지평선을 통과하고 음선이 나타나면 공백 신호가 발생한다
- 각각 K선에서 오버 바이 오버 셀 레벨을 넘어서면 대응 방향의 스톱로스를 달성합니다.
전략적 이점
- 높은 신호 신뢰도: 무작위 RSI와 <unk> 그래프의 이중 확인 메커니즘을 통해 거래 신호의 정확도가 크게 향상되었습니다.
- 리스크 관리가 완벽합니다: 명확한 중지 조건이 설정되어 각 거래의 위험을 효과적으로 제어할 수 있습니다.
- 매개 변수 조정성: 시장 특성에 따라 최적화된 매개 변수를 조정할 수 있다
- 시각적 피드백이 명확하다: 배경 색상과 그래픽 표시를 사용하여 거래 신호를 직관적으로 표시합니다.
- 높은 수준의 자동화: 신호 생성에서 주문 실행에 이르기까지 전체 프로세스를 자동화하고 인간의 개입을 줄입니다.
전략적 위험
- 변동 시장 위험: 변동 시장에서 빈번한 가짜 브레이크 신호가 발생할 수 있습니다.
- 지연 위험: 이동 평균의 계산은 지연성이 있으며, 최적의 입문점을 놓칠 수 있습니다.
- 변수 민감성: 다른 변수 설정은 전략 성능에 큰 영향을 미치며 지속적인 최적화가 필요합니다.
- 시장 환경 의존성: 급격히 변동하는 시장 환경에서는 신호가 안정적이지 않을 수 있습니다.
- 시스템적 위험: 시장에서 중요한 사건이 발생했을 때, 손실을 막는 설정이 작동하지 않을 수 있습니다.
전략 최적화 방향
- 거래량 지표 도입: 신호 확인의 추가 조건으로 거래량을 증가시킬 수 있다
- 최적화된 중지 메커니즘: 추적 중지 또는 ATR 동적 중지 사용이 고려될 수 있습니다.
- 트렌드 필터를 추가: 트렌드 필터로 장기 이동 평균을 추가
- 개선된 신호 필터링: 시장의 변동성을 고려하고, 높은 변동성으로 변수를 조정합니다.
- 동적 파라미터 조정: 시장 상태에 따라 동적으로 조정되는 오버 바이 오버 셀 <unk>값
요약하다
이 전략은 무작위 RSI 지표와 <unk> 그래프 형태를 결합하여 안정적인 거래 시스템을 구축한다. 시스템은 작동을 간소하게 유지하면서도 좋은 위험 관리를 실현한다. 합리적인 매개 변수 최적화 및 신호 필터링을 통해 전략은 다양한 시장 환경에 적응할 수 있다. 거래자는 실장에 사용하기 전에 충분한 역사적 데이터 재검토를 수행하고 특정 시장 특성에 따라 매개 변수 설정을 조정하는 것이 좋습니다.
Source
Pine
Strategy parameters
Related strategies
Comment
All comments (0)
No data
- 1