더블 스무딩 평균 추세 추종 전략 - 핑안강의 개선된 K-라인 기반

1
Follow
1781
Followers
개요
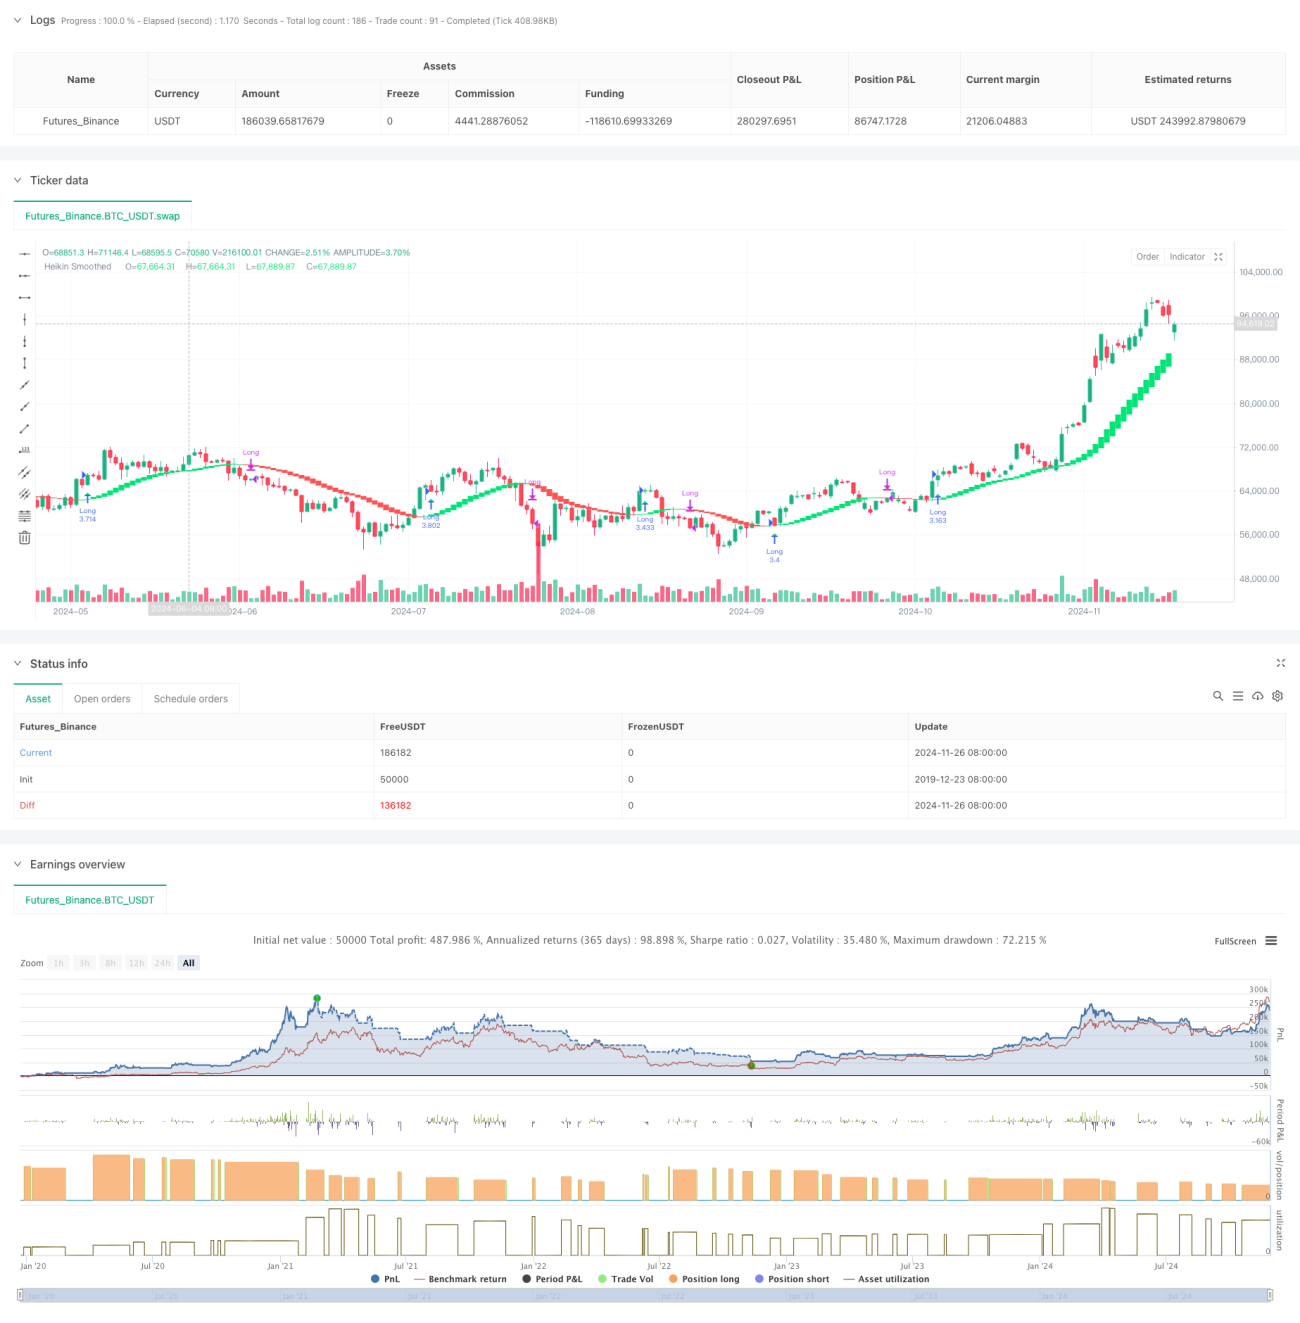
이 전략은 개량형 平安江氏 K선 ((Heikin-Ashi) 에 기반한 트렌드 추적 시스템이다. 전통적인 平安江氏 K선에 대해 이중 지수 이동 평균 ((EMA) 을 부드럽게 처리함으로써 시장 소음을 효과적으로 줄여주고 더 명확한 트렌드 신호를 제공한다. 전략은 단지 여러 가지 방법을 사용하여 상승 추세에서 지위를 유지하고 하락 추세에서 평소 위치를 전망하여 효율적인 추세 포착을 통해 시장 수익을 얻는다.
전략 원칙
전략의 핵심 논리에는 다음과 같은 주요 단계가 포함됩니다.
- OHLC 가격 데이터에 대한 첫 번째 EMA 연소
- 평형된 가격 계산을 이용한 개량형平安江氏K선
- 계산된 평강 K선에 대한 2차 EMA 평준화
- 평준화 후의 개시 가격과 종료 가격을 비교하여 K선 색상의 변화를 판단한다.
- K선에서 빨간색이 초록색으로 바뀌면 구매 신호가 발생하고 초록색이 빨간색으로 바뀌면 판매 신호가 발생
- 계좌 총액의 100% 포지션을 사용하여 거래
전략적 이점
- 이중 부드러운 처리는 False 신호를 현저히 감소
- 여러 가지 전략만 있으면 공백을 줄일 수 있습니다.
- 트렌드를 확인한 후에 출전해서 승률을 높여라
- 전체 신호 시스템은 자동 거래를 지원합니다.
- 다양한 거래 요구를 충족하는 유연한 시간 주기 선택
- 출전 규칙이 명확하고 간단해서 쉽게 실행할 수 있다
- 다양한 시장 조건의 자금 관리를 지원합니다.
전략적 위험
- 트렌드 반전의 초기에는 큰 회전이 발생할 수 있습니다.
- 시장의 흔들림으로 인해 연속적인 잘못된 신호가 발생할 수 있습니다.
- 전체 포지션 거래 방식은 자금 위험을 증가시킵니다.
- 입구 신호 지연으로 일부 상승이 놓쳐질 수도 있다.
- 다른 시간주기에 대한 성과 차이가 크다.
전략 최적화 방향
- 트렌드 강도 필터를 도입하여 흔들리는 시장의 가짜 신호를 줄여줍니다.
- 동적 보유량 관리를 강화하고 자금 활용을 최적화
- 이동식 상쇄 기능을 추가하여 회수 위험을 제어합니다.
- 다른 기술 지표와 함께 신호 유효성을 확인
- 전략 안정성을 높이기 위해 적응 변수 시스템을 개발
요약하다
이 전략은 이중 평형 처리 및 개선형平安江氏K선을 중심으로, 안정적인 트렌드 추적 시스템을 구축한다. 전략 설계는 간결하고 이해하기 쉽고 실행할 수 있으며, 다양한 시장 환경에 적응하기 위해 여러 가지 최적화 방향을 제공한다. 약간의 지연 및 철회 위험이 있지만, 합리적인 자금 관리 및 위험 제어 조치를 통해 전략은 투자자에게 신뢰할 수 있는 트렌드 추적 도구를 제공할 수 있다.
Source
Pine
/*backtest
start: 2019-12-23 08:00:00
end: 2024-11-27 08:00:00
period: 1d
basePeriod: 1d
exchanges: [{"eid":"Futures_Binance","currency":"BTC_USDT"}]
*/

//@version=5
strategy("Smoothed Heiken Ashi Strategy Long Only", overlay=true, initial_capital=1000, default_qty_type=strategy.percent_of_equity, default_qty_value=100)

len = input.int(10, title="EMA Length")Strategy parameters
Related strategies
Comment
All comments (0)
No data
- 1