다양한 추세 추종 및 구조적 돌파 전략

EMA RSI SL TP BOS
생성 날짜: 2024-11-29 15:27:01 마지막으로 수정됨: 2024-11-29 15:27:01
복사: 0 클릭수: 415
avatar of ChaoZhang ChaoZhang
1
집중하다
1617
수행원

다양한 추세 추종 및 구조적 돌파 전략

개요

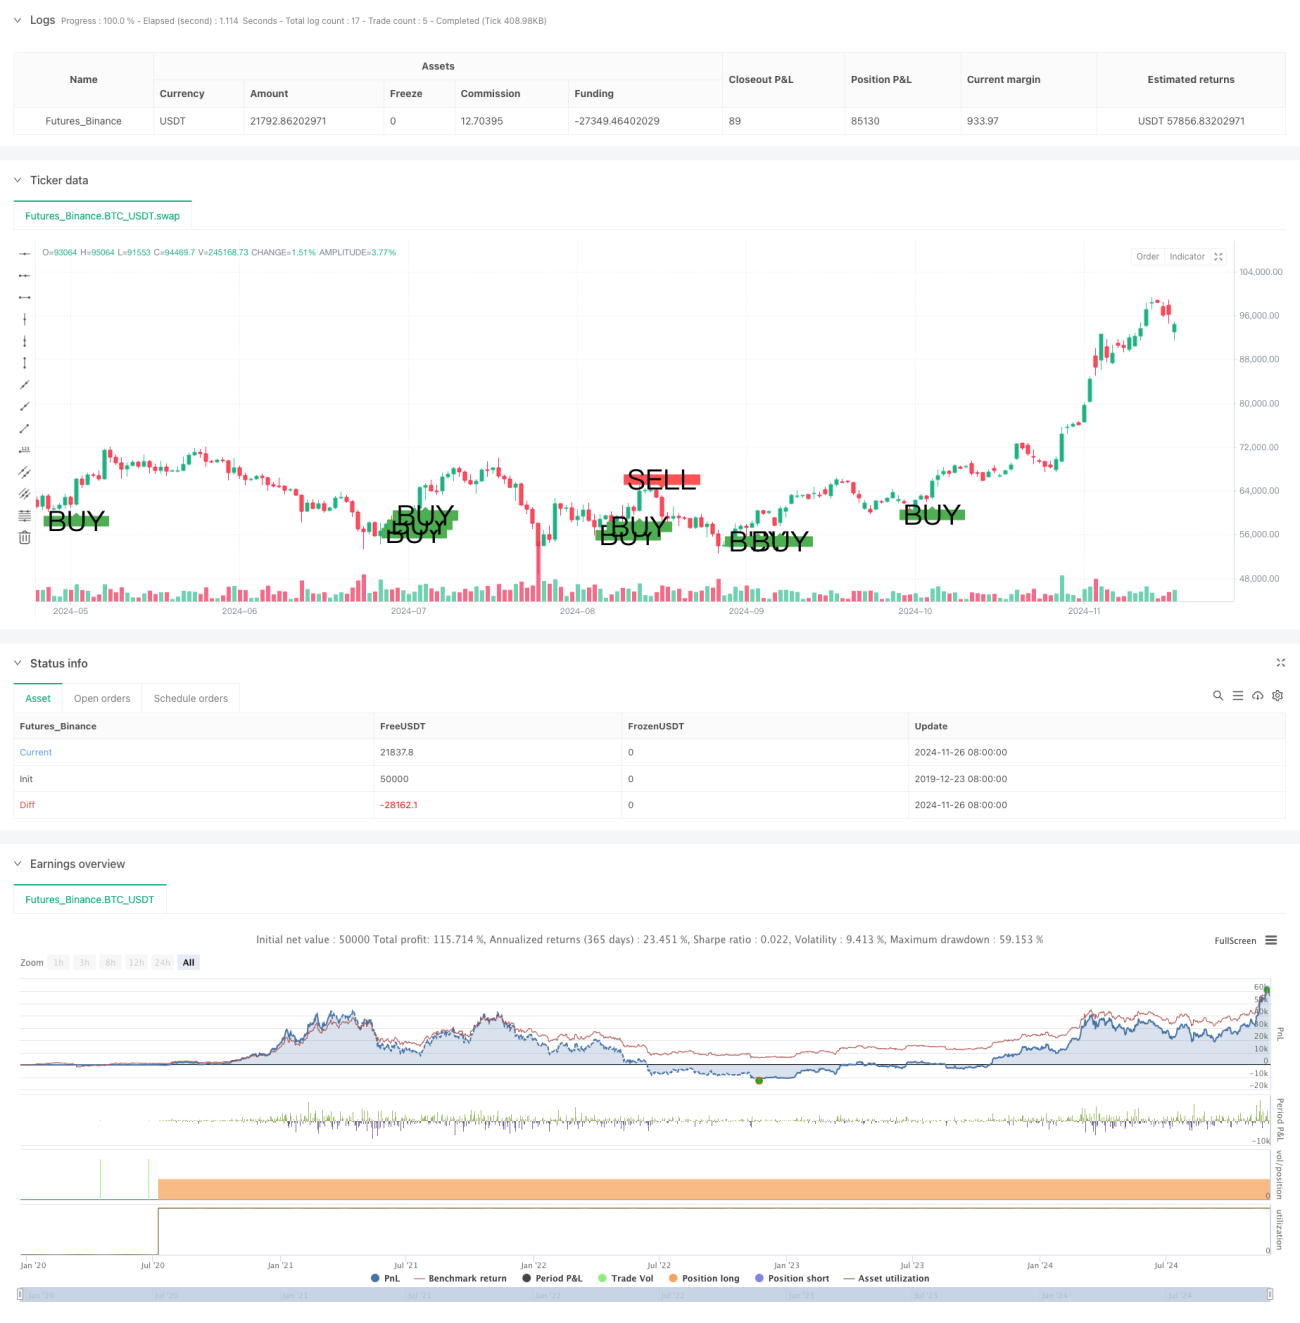
이것은 여러 평균선, 트렌드 추적, 구조적 돌파, 그리고 동력 지표를 결합한 포괄적인 거래 전략이다. 이 전략은 여러 시간 주기 동안의 경향 방향을 분석하면서 가격 구조적 돌파와 리콜 구매 방식을 결합하여 거래 신호를 결정한다. 이 전략은 고정된 중지 손실과 수익 목표를 사용하여 위험을 관리하고, 여러 검증 메커니즘을 통해 거래의 정확성을 향상시킨다.

전략 원칙

이 전략은 세 개의 지수 이동 평균 (EMA25, EMA50, EMA200) 을 사용하여 시장의 추세를 결정합니다. 가격이 EMA200 위에 있고 EMA200이 위쪽으로 기울어지면 상승 추세로 간주되며, 반대로 하향 추세로 간주됩니다. 트렌드 방향을 결정한 후, 전략은 가격의 EMA25 또는 EMA50에 대한 회귀 기회를 찾습니다.

전략적 이점

  1. 다중 인증 메커니즘이 거래의 신뢰성을 크게 향상시킵니다.
  2. 트렌드 분석과 동력 분석을 결합하여 가짜 돌파의 위험을 줄입니다.
  3. 명확한 스톱 로즈와 수익 목표가 감정 관리에 도움이 됩니다.
  4. 전략 논리는 간단하고 명확하며 이해하기 쉽고 실행이 가능합니다.
  5. 다양한 시장 환경과 거래 품종에 적합합니다.

전략적 위험

  1. 다중 조건으로 인해 일부 거래 기회를 놓칠 수 있습니다.
  2. 고정된 스톱 로즈 및 수익 목표가 모든 시장 환경에 적합하지 않을 수 있습니다.
  3. 급격한 변동이 있는 시장에서 빈번한 정지 손실을 유발할 수 있습니다.
  4. 전략적 매개 변수의 적합성을 확인하기 위해 지속적인 시장 모니터링이 필요합니다.
  5. 위축 시장에서 더 많은 가짜 신호가 발생할 수 있습니다.

전략 최적화 방향

  1. 적응형 정지 및 수익 목표 계산 방법을 도입합니다.
  2. 추가 거래량 분석을 보조 확인 지표로
  3. 시장 변동율 필터링 메커니즘에 대한 고려
  4. 트렌드 판단을 최적화하기 위한 시간주기를 선택합니다.
  5. 다양한 시장 환경에서의 전략의 적응력을 높이는 것

요약하다

이것은 합리적으로 설계된 포괄적 인 거래 전략이며, 여러 가지 기술 지표의 조합을 사용하여 거래 기회와 위험 관리를 효과적으로 균형을 맞추고 있습니다. 전략의 핵심 장점은 거래의 성공률을 높이는 데 도움이되는 엄격한 여러 가지 검증 메커니즘입니다.

전략 소스 코드
/*backtest
start: 2019-12-23 08:00:00
end: 2024-11-27 08:00:00
period: 1d
basePeriod: 1d
exchanges: [{"eid":"Futures_Binance","currency":"BTC_USDT"}]
*/

//@version=5
strategy("Custom Buy/Sell Strategy", overlay=true)

// Input parameters
ema25 = ta.ema(close, 25)
ema50 = ta.ema(close, 50)
ema200 = ta.ema(close, 200)
rsi = ta.rsi(close, 14)
sl_pips = 10
tp_pips = 15

// Convert pips to price units
sl_price_units = sl_pips * syminfo.pointvalue
tp_price_units = tp_pips * syminfo.pointvalue

// Define conditions for buy and sell signals
uptrend_condition = ema200 < close and ta.rising(ema200, 1)
downtrend_condition = ema200 > close and ta.falling(ema200, 1)

pullback_to_ema25 = low <= ema25
pullback_to_ema50 = low <= ema50
pullback_condition = pullback_to_ema25 or pullback_to_ema50

break_of_structure = high > ta.highest(high, 5)[1]
candle_imbalance = close > open

buy_condition = uptrend_condition and pullback_condition and rsi > 50 and break_of_structure and candle_imbalance

pullback_to_ema25_sell = high >= ema25
pullback_to_ema50_sell = high >= ema50
pullback_condition_sell = pullback_to_ema25_sell or pullback_to_ema50_sell

break_of_structure_sell = low < ta.lowest(low, 5)[1]
candle_imbalance_sell = close < open

sell_condition = downtrend_condition and pullback_condition_sell and rsi < 50 and break_of_structure_sell and candle_imbalance_sell

// Plot signals on the chart
plotshape(series=buy_condition, location=location.belowbar, color=color.green, style=shape.labelup, text="BUY", size=size.large)
plotshape(series=sell_condition, location=location.abovebar, color=color.red, style=shape.labeldown, text="SELL", size=size.large)

// Calculate stop loss and take profit levels for buy signals
var float buy_sl = na
var float buy_tp = na

if buy_condition and strategy.position_size == 0
    buy_sl := close - sl_price_units
    buy_tp := close + tp_price_units
    strategy.entry("Buy", strategy.long)
    strategy.exit("TP/SL Buy", from_entry="Buy", limit=buy_tp, stop=buy_sl)
    label.new(bar_index, high, text="Entry: " + str.tostring(close) + "\nSL: " + str.tostring(buy_sl) + "\nTP: " + str.tostring(buy_tp), style=label.style_label_up, color=color.green, textcolor=color.white, size=size.small)

// Calculate stop loss and take profit levels for sell signals
var float sell_sl = na
var float sell_tp = na

if sell_condition and strategy.position_size == 0
    sell_sl := close + sl_price_units
    sell_tp := close - tp_price_units
    strategy.entry("Sell", strategy.short)
    strategy.exit("TP/SL Sell", from_entry="Sell", limit=sell_tp, stop=sell_sl)
    label.new(bar_index, low, text="Entry: " + str.tostring(close) + "\nSL: " + str.tostring(sell_sl) + "\nTP: " + str.tostring(sell_tp), style=label.style_label_down, color=color.red, textcolor=color.white, size=size.small)

// // Plot stop loss and take profit levels for buy signals
// if not na(buy_sl)
//     line.new(x1=bar_index, y1=buy_sl, x2=bar_index + 1, y2=buy_sl, color=color.red, width=1)
// if not na(buy_tp)
//     line.new(x1=bar_index, y1=buy_tp, x2=bar_index + 1, y2=buy_tp, color=color.green, width=1)

// // Plot stop loss and take profit levels for sell signals
// if not na(sell_sl)
//     line.new(x1=bar_index, y1=sell_sl, x2=bar_index + 1, y2=sell_sl, color=color.red, width=1)
// if not na(sell_tp)
//     line.new(x1=bar_index, y1=sell_tp, x2=bar_index + 1, y2=sell_tp, color=color.green, width=1)