
1
Follow
1781
Followers
개요
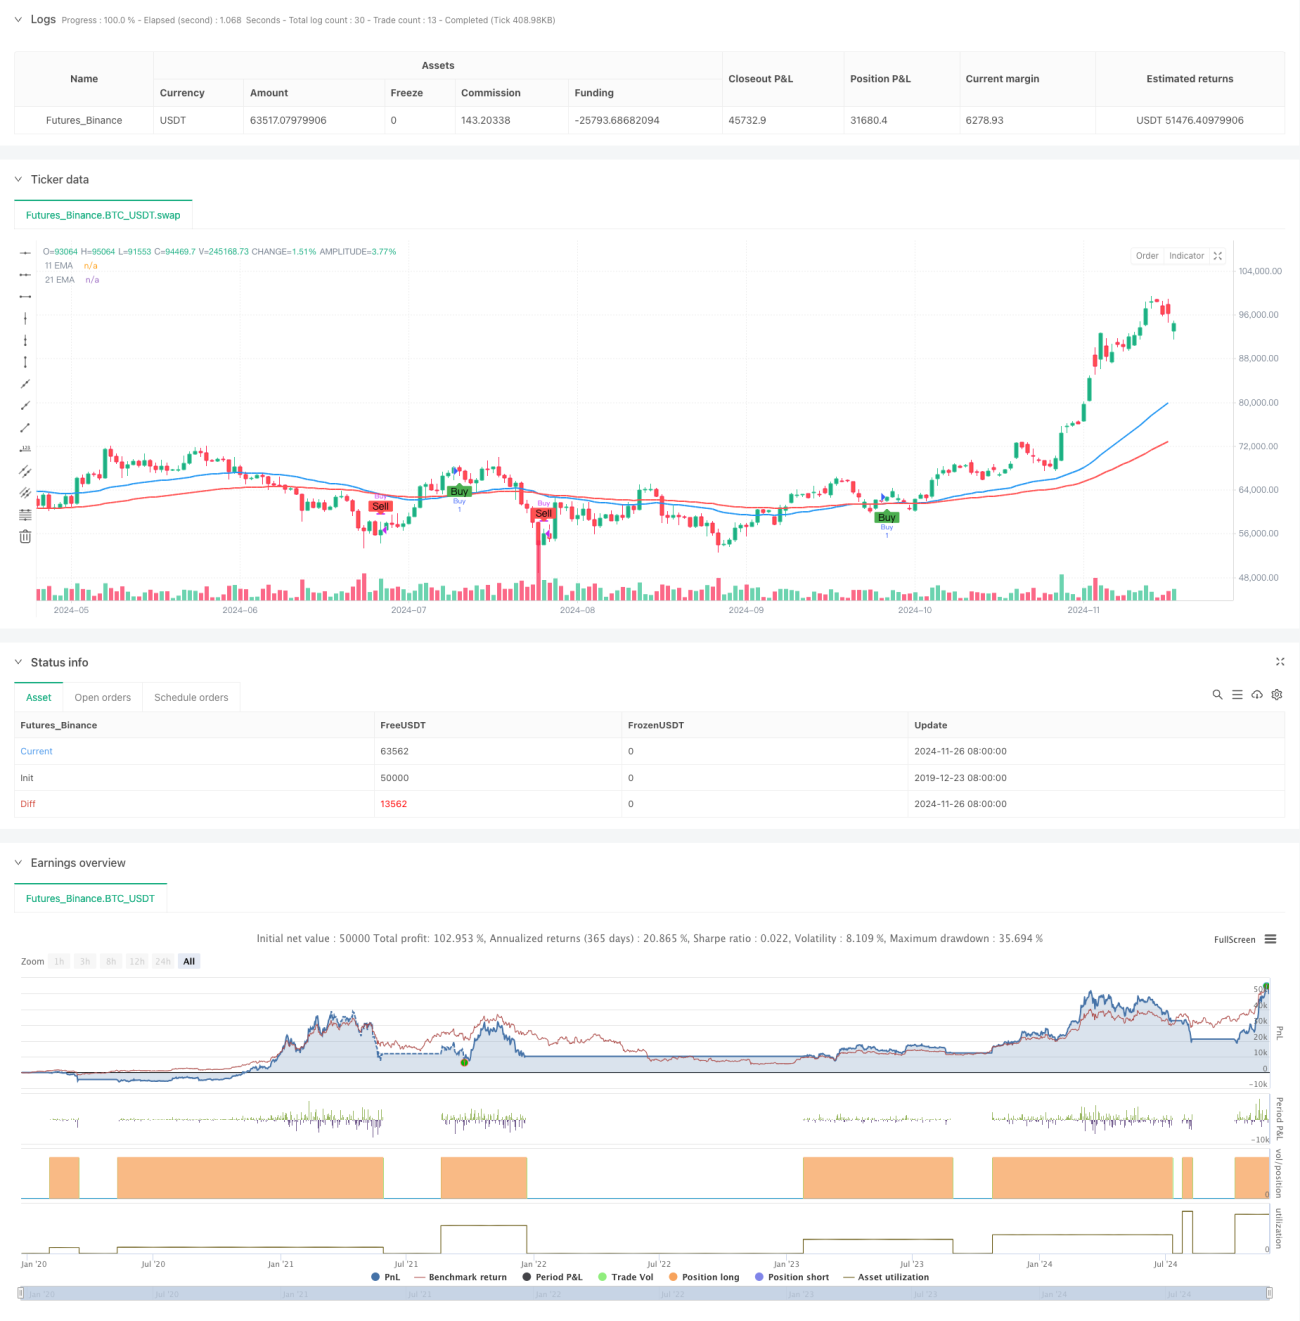
이 전략은 47주기 및 95주기 지수 이동 평균 ((EMA) 을 주로 사용하여 시장의 추세를 포착하고, 평행선 교차 신호를 통해 거래를 수행합니다. 이 전략은 15분 시간 주기에서 작동하며, 기술 분석과 동적 거래의 핵심 심리를 통합하여 안정적인 거래 수익을 달성하기 위해 고안되었습니다.
전략 원칙
전략의 핵심은 단기 EMA ((47주기) 와 장기 EMA ((95주기) 의 교차를 사용하여 트렌드 변화를 식별하는 것입니다. 단기 EMA가 상향으로 장기 EMA를 통과하면, 시스템은 여러 신호를 생성합니다. 단기 EMA가 하향으로 장기 EMA를 통과하면, 시스템은 평평합니다. 이 디자인은 가격 동력과 트렌드 연속성 원칙에 기반하여, 동선 교차를 통해 트렌드 전환점을 확인하여 시장의 주요 움직임을 파악합니다.
전략적 이점
- 신호 명확성: 쌍평선 교차는 명확한 진출 및 출구 신호를 제공하며, 주관적 판단으로 인한 불확실성을 감소시킨다.
- 트렌드 추적: 전략은 중·단기 트렌드를 효과적으로 포착하여 트렌드가 지속되는 동안 수익을 얻습니다.
- 자동화 수준: 전략 논리는 간단하고 명확하며, 프로그램으로 구현하고 재검증하기 쉽다.
- 적응성: 평균 주기 조정으로 전략은 다른 시장 환경과 거래 품종에 적응할 수 있다.
- 위험 조절: 체계화된 거래 규칙은 감정의 변동성을 조절하고 거래 규율을 유지하는데 도움이 됩니다.
전략적 위험
- 흔들리는 시장은 적용되지 않는다: 가로판 흔들리는 시장에서, 빈번한 가짜 돌파가 연속적인 손실을 초래할 수 있다.
- 지연성: 평균선 지표 자체는 지연성이 있으며, 최적의 진입 시기를 놓칠 수 있거나 트렌드 전환 시 큰 회수 현상이 발생할 수 있다.
- 변수 의존성: 평균선 주기 선택은 전략 성과에 큰 영향을 미치며, 다른 시장에는 다른 변수 설정이 필요할 수 있다.
- 자금 관리: 제대로 된 손해 방지 장치가 없는 상태에서는 급격한 변동으로 인해 큰 손실을 입을 수 있습니다.
전략 최적화 방향
- 변동률 지표를 도입: ATR 지표를 추가하여 스톱 로즈를 동적으로 조정하여 위험 제어 능력을 향상시킬 수 있다.
- 트렌드 필터를 추가합니다. RSI 또는 MACD와 같은 지표와 결합하여 더 신뢰할 수있는 거래 신호를 필터링합니다.
- 최적화 매개 변수 선택: 기계 학습 방법을 통해 서로 다른 시장 환경에 최적의 평균 선주기를 자동으로 선택할 수 있다.
- 재원 관리 개선: 포지션 관리 및 위험 제어 모듈을 추가하여 거래 당 최대 손실 비율을 설정합니다.
- 시장 환경 판단을 추가: 시장 구조 분석을 도입하여, 불안한 시장에서 거래 빈도를 낮추거나 거래를 중지한다.
요약하다
이것은 명확한 구조와 논리적으로 엄격한 트렌드 추적 전략이다. 쌍평선 교차를 통해 시장 추세를 포착하고, 더 나은 조작성과 확장성을 가지고 있다. 비록 일정 한계가 있지만, 지속적인 최적화와 개선을 통해 안정적이고 신뢰할 수 있는 거래 시스템으로 발전할 가능성이 있다.
Source
Pine
Related strategies
Comment
All comments (0)
No data
- 1