다중 이동 평균 교차 및 RSI 동적 트레일링 손절매 양적 거래 전략

MA RSI SMA SL TS
생성 날짜: 2024-11-29 16:10:35 마지막으로 수정됨: 2024-11-29 16:10:35
복사: 1 클릭수: 461
avatar of ChaoZhang ChaoZhang
1
집중하다
1617
수행원

다중 이동 평균 교차 및 RSI 동적 트레일링 손절매 양적 거래 전략

개요

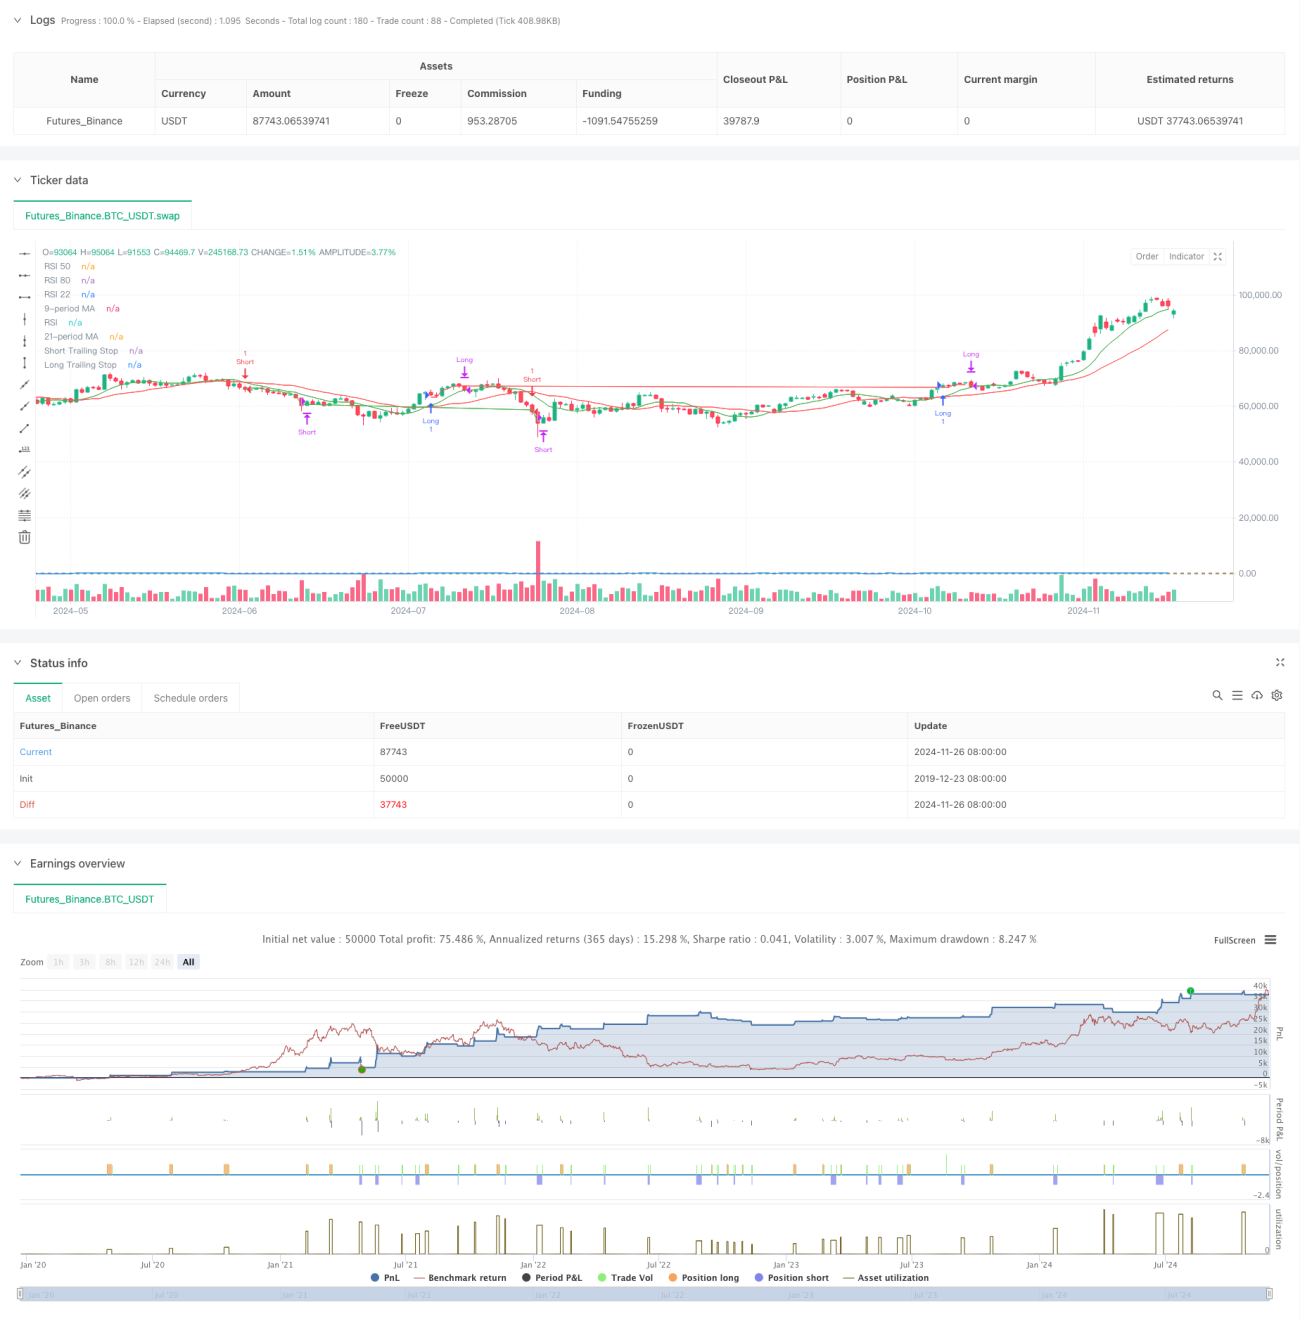
이 전략은 이동 평균의 교차와 상대적으로 강한 지수 ((RSI) 를 결합한 양적 거래 시스템이며, 또한 손실 추적 기능을 통합합니다. 이 전략은 9주기 및 21주기 이동 평균을 주요 트렌드 판단 지표로 사용하고, RSI 지표와 함께 거래 신호를 확인하고, 동적으로 손실을 추적하여 수익을 보호하고 위험을 제어합니다. 전략 설계는 시장 추세, 동력 및 위험 관리의 세 가지 차원을 충분히 고려하여 완전한 거래 시스템을 형성합니다.

전략 원칙

전략의 핵심 논리는 다음과 같은 핵심 요소에 기초합니다.

  1. 트렌드 식별: 빠른 (주기) 와 느린 (<21주기) 이동 평균의 교차로 시장 추세의 변화를 식별한다. 빠른 선에서 느린 선을 통과하고 RSI가 55보다 크면 다중 신호를 발생시키고, 빠른 선 아래의 느린 선을 통과하고 RSI가 45보다 작으면 공백 신호를 발생시킨다.
  2. 신호 확인: RSI를 신호 필터로 사용하여 RSI 마이너스를 설정하여 거래 신호의 신뢰성을 향상시킵니다.
  3. 위험 제어: 1%의 추적 스톱을 사용하여, 수익을 보호하기 위해 스톱 포지션을 동적으로 조정한다. RSI 기반의 수익을 얻은 종료 조건을 설정하면서, RSI가 80 이상 또는 22 이하일 때 각각 상위 포지션과 공백 포지션을 평정한다.
  4. 스톱스 메커니즘: 고정 스톱스 및 추적 스톱스를 결합하여, 가격이 입구 지점의 사전 설정된 비율을 뚫거나 추적 스톱스 라인을 만지면 자동으로 포지션을 청산한다.

전략적 이점

  1. 다차원 신호 검증: 평행선 교차와 RSI 이중 확인을 통해 거래 신호의 정확도를 높인다.
  2. 완벽한 위험 관리: 동적으로 손실을 추적하여 수익을 보호하고 위험을 통제합니다.
  3. 유연한 입시 메커니즘: 동향과 동력 지표와 결합하여 시장의 전환점을 효과적으로 포착할 수 있다.
  4. 자동화 수준: 전략 논리가 명확하고 자동화 거래가 쉽다.
  5. 적응력: 매개 변수를 조정하여 다른 시장 환경에 적응할 수 있다.

전략적 위험

  1. 흔들림 시장 위험: 가로판 흔들림 시장에서 빈번한 가짜 브레이크 신호가 발생할 수 있다.
  2. 슬라이드 포인트 위험: 스톱 로드 실행을 추적하는 과정에서 슬라이드 포인트 손실에 직면 할 수 있습니다.
  3. 매개 변수 민감성: 평균선 주기 및 RSI 절댓값의 설정이 전략 성능에 큰 영향을 미칩니다.
  4. 시스템적 위험: 극단적인 상황에서는, 정지는 제때 실행되지 않을 수 있습니다.

전략 최적화 방향

  1. 신호 최적화: 신호 확인의 보충 조건으로 수송량 지표를 도입할 수 있다.
  2. 스톱 로즈 최적화: 변동률에 기반한 동적 스톱 로즈 비율 조정 메커니즘을 고려한다.
  3. 포지션 관리: 위험 평가에 기반한 동적 포지션 관리 시스템을 추가한다.
  4. 시장 적응성: 시장 환경 식별 메커니즘을 추가하여 다른 시장 상태에서 다른 파라미터 설정을 사용합니다.
  5. 신호 필터: 시간 필터를 추가하여 시장 개시와 종결 전의 변동적인 시간대에 거래하는 것을 피할 수 있습니다.

요약하다

이 전략은 기술 분석의 고전적 지표를 결합하여 트렌드 추적과 동력 특성을 겸비한 거래 시스템을 구축한다. 그것의 핵심 장점은 다차원적인 신호 확인 메커니즘과 완벽한 위험 관리 시스템이다. 지속적인 최적화 및 개선으로, 이 전략은 다양한 시장 환경에서 안정적인 성능을 유지할 것으로 보인다.

전략 소스 코드
/*backtest
start: 2019-12-23 08:00:00
end: 2024-11-27 08:00:00
period: 1d
basePeriod: 1d
exchanges: [{"eid":"Futures_Binance","currency":"BTC_USDT"}]
*/

//@version=5
strategy("ojha's Intraday MA Crossover + RSI Strategy with Trailing Stop", overlay=true)

// Define Moving Averages
fastLength = 9
slowLength = 21
fastMA = ta.sma(close, fastLength)
slowMA = ta.sma(close, slowLength)

// Define RSI
rsiPeriod = 14
rsiValue = ta.rsi(close, rsiPeriod)

// Define Conditions for Long and Short
longCondition = ta.crossover(fastMA, slowMA) and rsiValue > 55
shortCondition = ta.crossunder(fastMA, slowMA) and rsiValue < 45

// Define the trailing stop distance (e.g., 1% trailing stop)
trailingStopPercent = 1.0

// Variables to store the entry candle high and low
var float longEntryLow = na
var float shortEntryHigh = na

// Variables for trailing stop levels
var float longTrailingStop = na
var float shortTrailingStop = na

// Exit conditions
exitLongCondition = rsiValue > 80
exitShortCondition = rsiValue < 22

// Stop-loss conditions (price drops below long entry candle low * 1% or exceeds short entry candle high * 1%)
longStopLoss = longEntryLow > 0 and close < longEntryLow * 0.99
shortStopLoss = shortEntryHigh > 0 and close > shortEntryHigh * 1.01

// Execute Buy Order and store the entry candle low for long stop-loss
if (longCondition)
    strategy.entry("Long", strategy.long)
    longEntryLow := low  // Store the low of the candle where long entry happened
    longTrailingStop := close * (1 - trailingStopPercent / 100)  // Initialize trailing stop at entry

// Execute Sell Order and store the entry candle high for short stop-loss
if (shortCondition)
    strategy.entry("Short", strategy.short)
    shortEntryHigh := high  // Store the high of the candle where short entry happened
    shortTrailingStop := close * (1 + trailingStopPercent / 100)  // Initialize trailing stop at entry

// Update trailing stop for long position
if (strategy.opentrades > 0 and strategy.position_size > 0)
    longTrailingStop := math.max(longTrailingStop, close * (1 - trailingStopPercent / 100))  // Update trailing stop as price moves up

// Update trailing stop for short position
if (strategy.opentrades > 0 and strategy.position_size < 0)
    shortTrailingStop := math.min(shortTrailingStop, close * (1 + trailingStopPercent / 100))  // Update trailing stop as price moves down

// Exit Buy Position when RSI is above 80, Stop-Loss triggers, or trailing stop is hit
if (exitLongCondition or longStopLoss or close < longTrailingStop)
    strategy.close("Long")
    longEntryLow := na  // Reset the entry low after the long position is closed
    longTrailingStop := na  // Reset the trailing stop

// Exit Sell Position when RSI is below 22, Stop-Loss triggers, or trailing stop is hit
if (exitShortCondition or shortStopLoss or close > shortTrailingStop)
    strategy.close("Short")
    shortEntryHigh := na  // Reset the entry high after the short position is closed
    shortTrailingStop := na  // Reset the trailing stop

// Plot Moving Averages on the Chart
plot(fastMA, color=color.green, title="9-period MA")
plot(slowMA, color=color.red, title="21-period MA")

// Plot RSI on a separate panel
rsiPlot = plot(rsiValue, color=color.blue, title="RSI")
hline(50, "RSI 50", color=color.gray)
hline(80, "RSI 80", color=color.red)
hline(22, "RSI 22", color=color.green)

// Plot Trailing Stop for Visualization
plot(longTrailingStop, title="Long Trailing Stop", color=color.red, linewidth=1, style=plot.style_line)
plot(shortTrailingStop, title="Short Trailing Stop", color=color.green, linewidth=1, style=plot.style_line)