
1
Follow
1780
Followers
개요
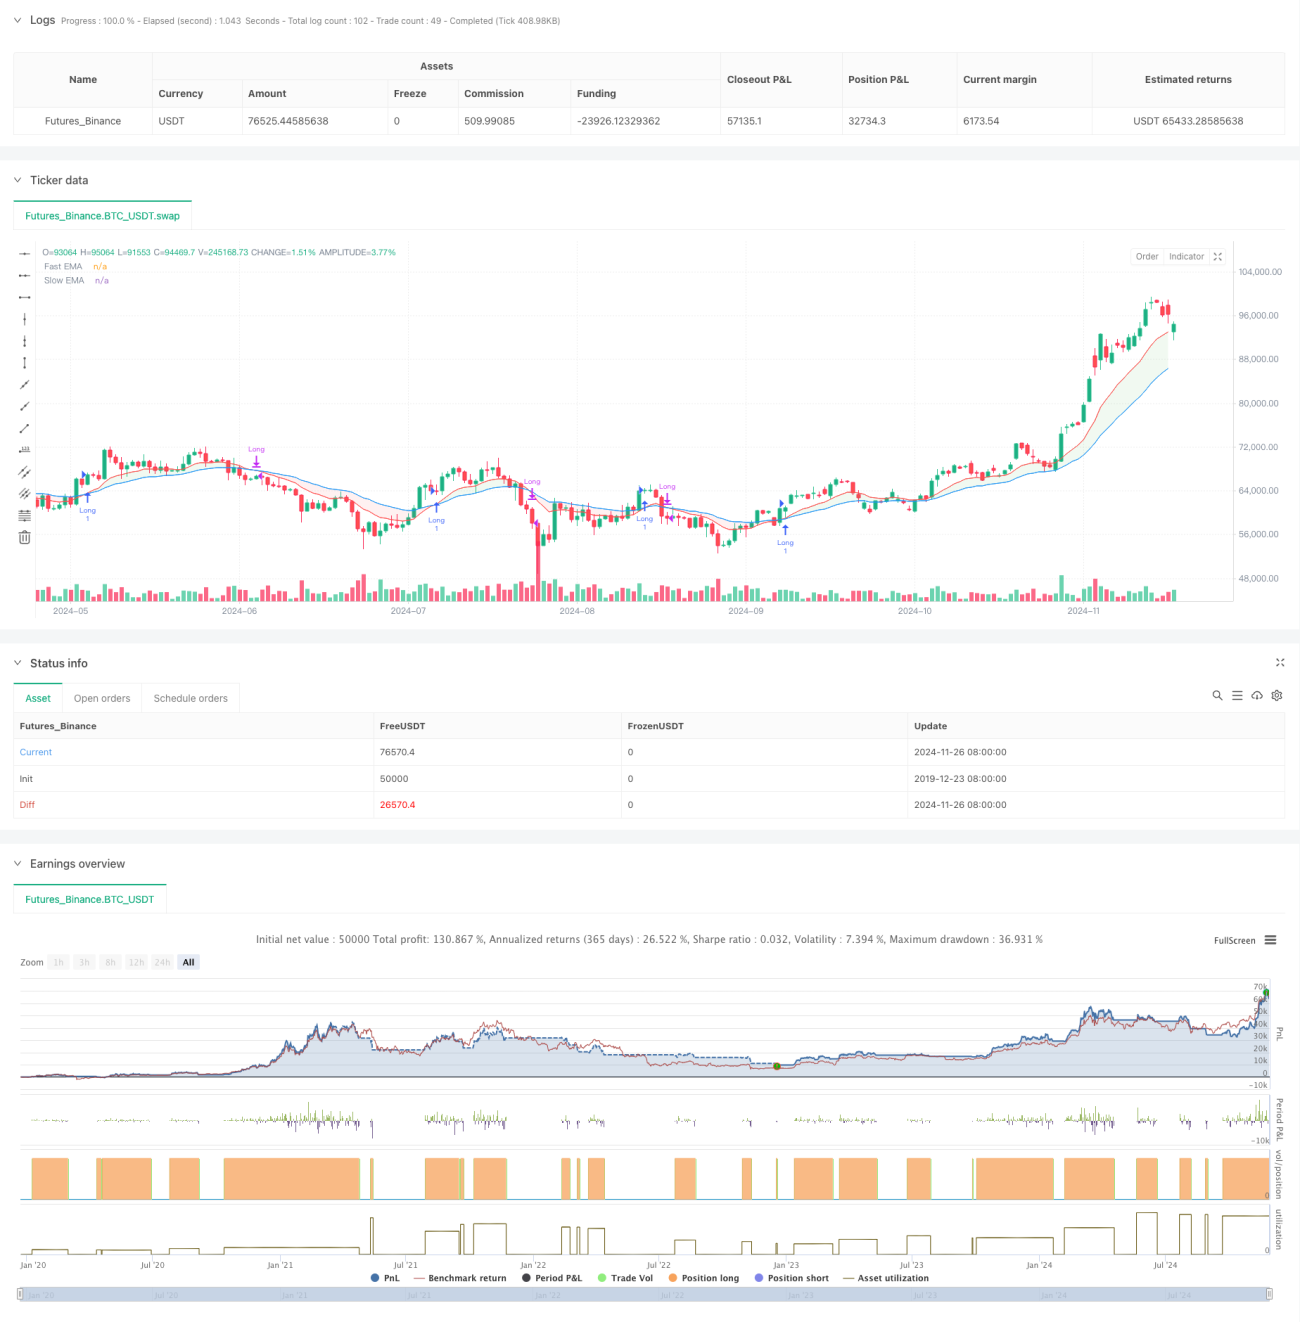
이 전략은 쌍평균선 ((빠른 EMA와 느린 EMA) 을 기반으로 한 동적 지역 트렌드 추적 시스템이다. 가격과 쌍평균선 사이의 위치 관계에 대해 서로 다른 거래 지역을 구분하여, 동적 색상 지시 시스템과 결합하여 거래자에게 명확한 매매 신호를 제공한다. 전략은 고전적인 평평선 교차 이론을 채택하고, 지역 분할의 혁신적인 방법을 통해 전통적인 쌍평균선 시스템의 작동성을 향상시킨다.
전략 원칙
이 전략의 핵심은 빠른 EMA (기본 12주기) 와 느린 EMA (기본 26주기) 의 교차 관계를 통해 가격 위치와 결합하여 시장 상태를 여섯 가지 다른 영역으로 나누는 것입니다. 빠른 선이 느린 선 위에 있을 때, 시장은 다중 트렌드에 있다고 간주되며, 반대로 공백 트렌드로 간주됩니다. 이 두 평행 선에 대한 가격의 위치는 구체적인 거래 영역을 더욱 세분화합니다.
전략적 이점
- 시각적 직관성: 색상 영역의 동적인 변화를 통해 거래자는 시장 상태와 잠재적인 거래 기회를 직관적으로 판단할 수 있다.
- 트렌드 확인: 이중 동선 시스템은 신뢰할 수 있는 트렌드 확인 메커니즘을 제공하여 잘못된 신호를 줄인다.
- 위험 관리: 명확한 지역 구분은 손실을 막는 전략을 수립하는 데 도움이 됩니다.
- 적응성: 전략은 다양한 시기를 적용할 수 있으며, 다양한 시장 환경에 적합하다.
- 매개 변수는 조정할 수 있다: 평균선 주기 및 미끄러운 매개 변수는 다른 시장 특성에 따라 최적화 할 수 있다.
전략적 위험
- 뒤처짐: 평균선 지표는 본질적으로 뒤처짐이 있으며, 출전 또는 출전 시간을 지연시킬 수 있다.
- 흔들림 시장은 적용되지 않는다: 가로판 흔들림 시장에서 빈번하게 잘못된 신호가 발생할 수 있다.
- 트렌드 반전 위험: 트렌드가 급격히 변할 경우, 전략적 반응이 충분히 빠르지 않을 수 있다.
- 매개 변수 의존성: 다른 시장 환경에서 최적 매개 변수가 현저하게 다를 수 있다.
전략 최적화 방향
- 변동율 필터를 도입: 높은 변동율 환경에서 거래 조건을 조정하여 가짜 신호를 피한다.
- 트랜지스 양을 높여 확인: 합성 트랜지스 지표가 신호 신뢰도를 높여준다.
- 동적 변수 조정: 시장 상태에 따라 평균 선주기를 자동으로 조정한다.
- 트렌드 강도 지표를 추가: ADX와 같은 지표가 트렌드 강도를 평가한다.
- 최적화 중단 전략: ATR 기반의 동적 중단 계획을 설계한다.
요약하다
이 전략은 전통적인 쌍방향 시스템과 현대적인 구역화 개념을 결합한 트렌드 추적 전략이다. 직관적인 시각적 피드백과 명확한 거래 규칙으로 거래자에게 신뢰할 수있는 거래 프레임 워크를 제공합니다. 일률적인 시스템의 고유한 지연 문제가 있음에도 불구하고, 합리적인 파라미터 최적화 및 위험 관리를 통해 이 전략은 트렌드 시장에서 안정적인 성능을 얻을 수 있습니다.
Source
Pine
/*backtest
start: 2019-12-23 08:00:00
end: 2024-11-27 08:00:00
period: 1d
basePeriod: 1d
exchanges: [{"eid":"Futures_Binance","currency":"BTC_USDT"}]
*/

//@version=5
strategy("NUTJP CDC ActionZone 2024", overlay=true, precision=6, commission_value=0.1, slippage=3)

//****************************************************************************//Strategy parameters
Related strategies
Comment
All comments (0)
No data
- 1