SMA 크로스오버 트렌드 팔로잉 전략과 결합된 매끄러운 하이킨-아시

SHA SMA EMA
생성 날짜: 2024-11-29 16:39:12 마지막으로 수정됨: 2024-11-29 16:39:12
복사: 0 클릭수: 434
avatar of ChaoZhang ChaoZhang
1
집중하다
1617
수행원

SMA 크로스오버 트렌드 팔로잉 전략과 결합된 매끄러운 하이킨-아시

개요

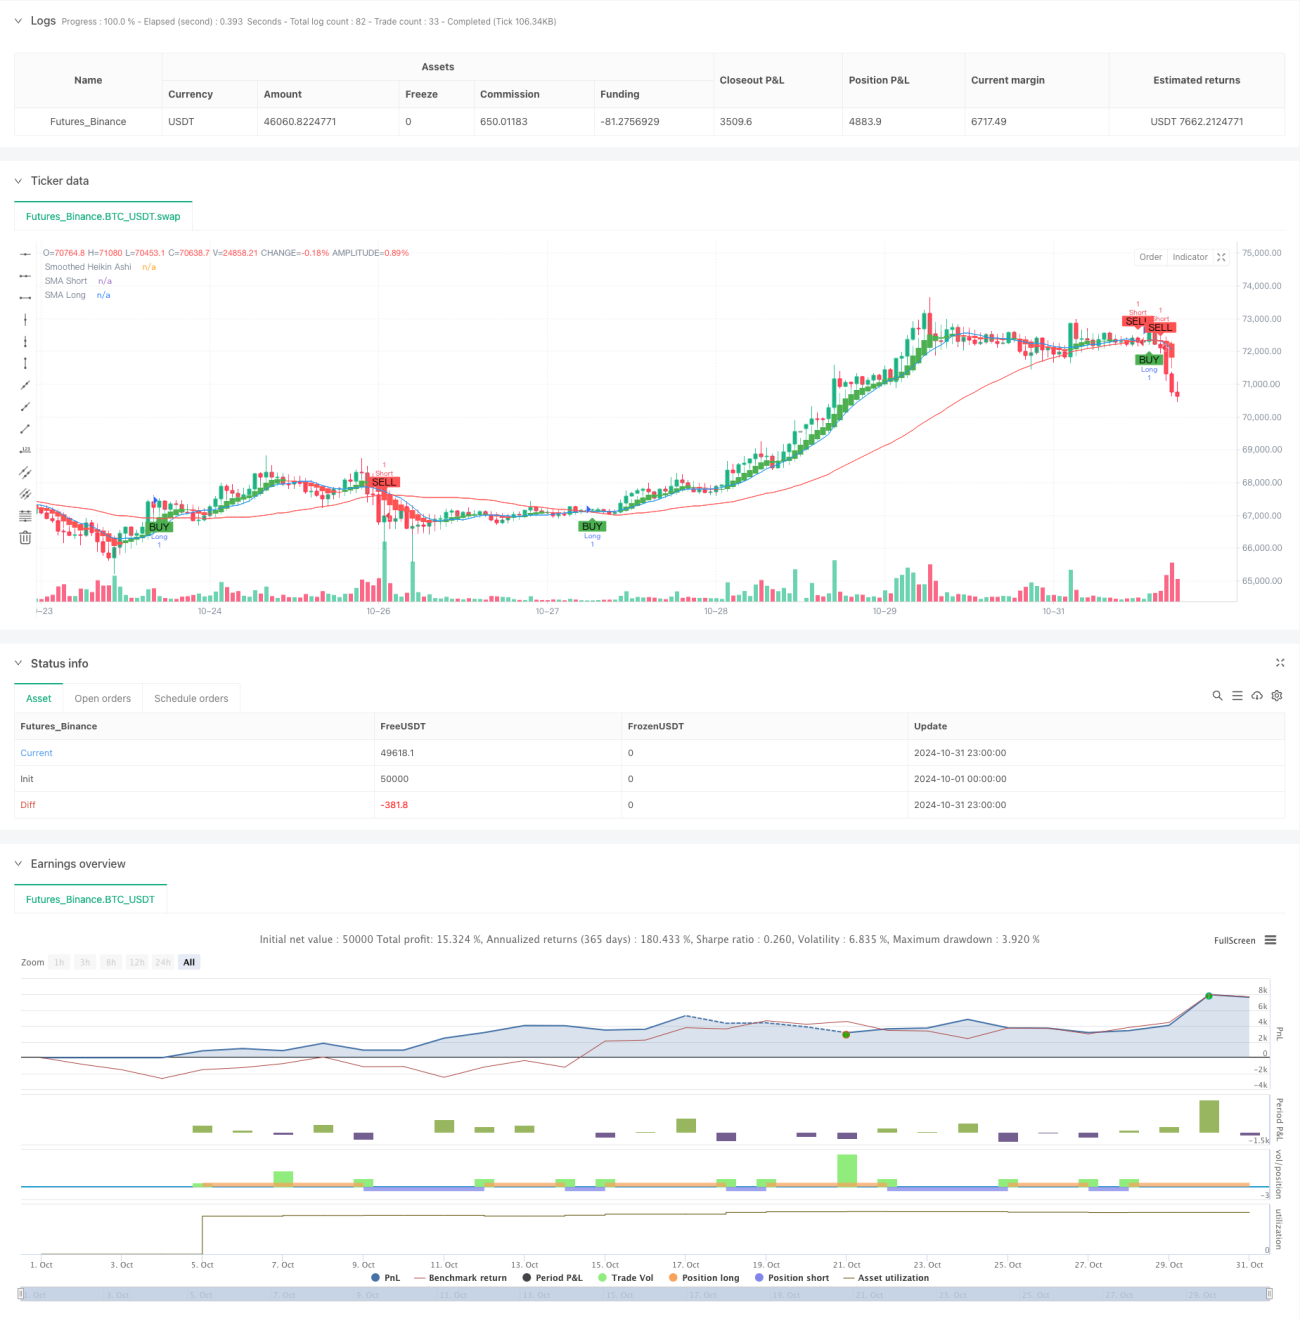
이 전략은 평형형 Heikin-Ashi 도표와 간단한 이동 평균 ((SMA) 의 교차에 기반한 트렌드 추적 시스템이다. 전략은 EMA 평형 처리를 받은 Heikin-Ashi 도표와 44주기 SMA의 교차를 통해 트렌드의 변화를 식별하여 시장의 주요 트렌드적 기회를 포착한다. 전략은 동적인 포지션 관리 메커니즘을 설계하고 있으며, 가격이 장기 평균선과 근접한 거리가 지나면 자동으로 평소되어 전체 시장의 변동 위험을 회피한다.

전략 원칙

전략의 핵심 논리에는 세 가지 핵심 요소가 포함되어 있습니다. 첫째, 전통적인 K선을 Heikin-Ashi 도표로 변환하여 4가지 가격의 수학적 평균을 계산하여 시장의 잡음을 필터링합니다. 둘째, 6주기 EMA를 사용하여 Heikin-Ashi를 부드럽게 처리하여 신호의 신뢰성을 더욱 향상시킵니다.

전략적 이점

  1. 신호 필터링 메커니즘이 완성되어, Heikin-Ashi와 EMA 이중 평준화를 통해 가짜 돌파의 가능성을 현저히 감소시킨다.
  2. 트렌드 추적 논리는 명확하고, 큰 트렌드 상황을 효과적으로 포착합니다.
  3. 역동적인 스피드 메커니즘을 설계하여横盤整理時及時離場
  4. 파라미터를 합리적으로 설정하고, 단기 평균선 11주기와 장기 평균선 44주기의 대립은 시장운동법칙에 부합한다
  5. 영상화 효과는 훌륭하고 거래 신호는 명확하고 직관적입니다.

전략적 위험

  1. 트렌드 반전의 초기에는 약간의 지연이 발생할 수 있으며, 이는 진입 시기를 약간 지연시킬 수 있습니다.
  2. 시장의 격렬한 변동 속에서 잘못된 교차 신호가 발생할 수 있습니다.
  3. 매개 변수 설정에 민감하며, 다른 품종에는 타겟 조정이 필요할 수 있습니다.
  4. 시장에서 거래가 빈번하게 이루어질 수 있습니다

전략 최적화 방향

  1. 트렌드 강도 필터, 예를 들어 ADX 지표를 추가하여 트렌드가 명백한 경우에만 포지션을 열 것을 권장합니다.
  2. 양과 가격에 맞는 거래 확인 메커니즘을 도입하여 신호의 신뢰성을 높일 수 있습니다.
  3. 중요한 가격 근처에서 자주 거래하는 것을 피하기 위해 슬라이드 포인트 제도를 고려하십시오.
  4. 동적인 스톱 스톱 손실 메커니즘을 설계할 수 있으며 시장의 변동에 따라 자동으로 조정할 수 있습니다.
  5. 포지션 관리 모듈을 추가하여 트렌드 강도에 따라 포지션 비율을 동적으로 조정하는 것이 좋습니다.

요약하다

이 전략은 Heikin-Ashi 도표와 SMA 평선 시스템을 결합하여 안정적인 트렌드 추적 거래 시스템을 구축한다. 전략의 신호 생성 메커니즘은 완벽하고, 위험 통제는 합리적이며, 특히 트렌드 특징이 뚜렷한 시장에서 적용하기에 적합하다. 제안된 최적화 방향을 통해 전략의 실전 효과를 더욱 향상시킬 수 있다.

전략 소스 코드
/*backtest
start: 2024-10-01 00:00:00
end: 2024-10-31 23:59:59
period: 1h
basePeriod: 1h
exchanges: [{"eid":"Futures_Binance","currency":"BTC_USDT"}]
*/

//@version=5
strategy("Smoothed Heikin Ashi with SMA Strategy", overlay=true)

// Input parameters for SMAs
s1 = input.int(11, title="Short SMA Period")
s2 = input.int(44, title="Long SMA Period")
noPositionThreshold = input.float(0.001, title="No Position Threshold", step=0.0001)

// Calculate the original Heikin-Ashi values
haClose = (open + high + low + close) / 4
var float haOpen = na
haOpen := na(haOpen[1]) ? (open + close) / 2 : (haOpen[1] + haClose[1]) / 2
haHigh = math.max(high, math.max(haOpen, haClose))
haLow = math.min(low, math.min(haOpen, haClose))

// Smoothing using exponential moving averages
smoothLength = input.int(6, title="Smoothing Length")
smoothedHaClose = ta.ema(haClose, smoothLength)
smoothedHaOpen = ta.ema(haOpen, smoothLength)
smoothedHaHigh = ta.ema(haHigh, smoothLength)
smoothedHaLow = ta.ema(haLow, smoothLength)

// Calculate SMAs
smaShort = ta.sma(close, s1)
smaLong = ta.sma(close, s2)

// Plotting the smoothed Heikin-Ashi values
plotcandle(smoothedHaOpen, smoothedHaHigh, smoothedHaLow, smoothedHaClose, color=(smoothedHaClose >= smoothedHaOpen ? color.green : color.red), title="Smoothed Heikin Ashi")
plot(smaShort, color=color.blue, title="SMA Short")
plot(smaLong, color=color.red, title="SMA Long")

// Generate buy/sell signals based on SHA crossing 44 SMA
longCondition = ta.crossover(smoothedHaClose, smaLong)
shortCondition = ta.crossunder(smoothedHaClose, smaLong)
noPositionCondition = math.abs(smoothedHaClose - smaLong) < noPositionThreshold

// Strategy logic
if (longCondition)
    strategy.entry("Long", strategy.long)
if (shortCondition)
    strategy.entry("Short", strategy.short)
if (noPositionCondition and strategy.position_size != 0)
    strategy.close_all("No Position")

// Plot buy/sell signals
plotshape(series=longCondition, location=location.belowbar, color=color.green, style=shape.labelup, text="BUY", size=size.small)
plotshape(series=shortCondition, location=location.abovebar, color=color.red, style=shape.labeldown, text="SELL", size=size.small)
plotshape(series=noPositionCondition and strategy.position_size != 0, location=location.belowbar, color=color.yellow, style=shape.labeldown, text="EXIT", size=size.small)